Data collection in statistics is a process of gathering information from the relevant sources to find a solution to a research problem. Data analysts gather data from primary and secondary sources to help them find an answer to a data-related business question (e.g., what was the percentage of sales change over the past six months?). This post constitutes Lesson 1 of the Basic Statistics Mini-Course.
You may be also interested in Data presentation in statistics.
Key concepts covered in this post: data sources, random samples, table of random digits, simulations, tally charts, data collection methods, types of data.
Data sources and random samples
Data sources include surveys, questionnaires, interviews, observations, experiments, simulations, books, newspapers, and databases (see Data collection methods).
A population is the whole group of people or elements being studied. Often it is not practical or possible to study the whole population. A sample is part of the population from which data will actually be collected. A random sample is a sample in which each member of the population has an equal chance of being selected. Random representative samples of the population are used to avoid biasing the results (to ensure the accuracy of predictions).
Methods of selecting random samples include drawing names from a hat, selecting every third name in a phone book, and using a table of random digits. Scientific calculators have the function Random or Rand to generate random numbers.
A simulation can be performed when data collection is impractical by conducting an experiment that has the same probability. Two common techniques would be tossing a coin when the probability of the event being investigated is 1/2, and spinning a spinner wheel divided into the number of sections corresponding to (has the same probability as) the test phenomenon.
Data can be recorded in a tally chart to keep track of the totals. Example: A restaurant owner wants to know which dishes are the most popular among her customers. She records the results of a survey in a tally chart.
| Dish | Tally (frequency) | Ratio | Percentage |
|---|---|---|---|
| Pizza | 9 | 9/27 | 33.3% |
| Chicken fingers | 6 | 6/27 | 22.2% |
| Soup and sandwich | 12 | 12/27 | 44.4% |
| Total | 27 | 27/27 | 100% |
Data collection methods
Qualitative research data collection methods tend to be purposeful (in sampling) and are usually case study based. Common qualitative data collection methods include in-depth interviews, document reviews, and observational research methods.
Quantitative research data collection methods tend to rely on random sampling. They include surveys/questionnaires, polls, and experiments.
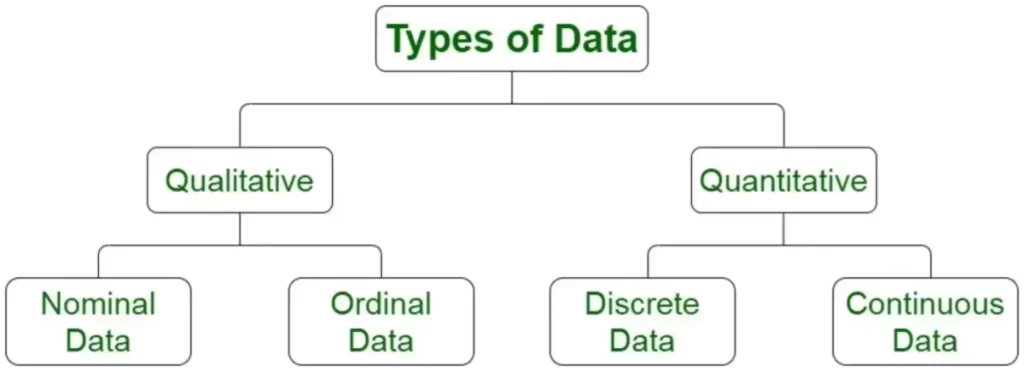
Types of data
There are two types of data: Qualitative and Quantitative. Those are further classified into four types of data: nominal, ordinal, discrete, and Continuous.
Qualitative or categorical data are data that cannot be measured or counted in the form of numbers.
Qualitative data are further classified into two types: nominal and ordinal. Nominal data are used to label variables without any order or quantitative value. Examples of nominal data are gender, hair colour, and ethnicity. Ordinal data have natural ordering where a number is present in some kind of order by their position on the scale. The values of ordinal data have some kind of a relative position. Examples of ordinal data are rankings (first, second, and third), letter grades (A, B, and C), and education level (primary, secondary, and higher).
Quantitative data can be expressed in numerical values. Quantitative data can be represented by a wide variety of graphs and charts, such as bar graphs, histograms, and scatter plots.
Quantitative data are further classified into two types: discrete and continuous. Discrete data are integers or whole numbers. Examples of discrete data are the number of students in a class, the number of players participating in a game, and days of the week. Continuous data are in the form of fractional numbers. Continuous data can be divided into smaller variables. A continuous variable can take any value within a range. Examples of continuous data are the height of children, the speed of cars, and market share price.
Key references
GeeksforGeeks. (2021, Oct 29). Explain different types of data in statistics. https://www.geeksforgeeks.org/explain-different-types-of-data-in-statistics/
Great Learning Team. (2021, Sep 27). 4 Types Of Data – Nominal, Ordinal, Discrete and Continuous. https://www.mygreatlearning.com/blog/types-of-data/
Sinclair, Margaret. (1999). How to Get an A in: Statistics & Data Analysis. Coles Publishing, Toronto.
Next post: Part 2: Data presentation in statistics
Key concepts: Frequency distributions and histograms, graphical representations of data, comparing graphs, stem and leaf plots.
Back to Basic Statistics Mini-Course
Back to DTI Courses
Related content
Bivariate statistics or two variable statistics
Data presentation in statistics
Normal approximation to the binomial distribution
Normal distribution or Gaussian distribution
Other content
1st Annual University of Ottawa Supervisor Bullying ESG Business Risk Assessment Briefing
Disgraced uOttawa President Jacques Frémont ignores bullying problem
How to end supervisor bullying at uOttawa
PhD in DTI uOttawa program review
Rocci Luppicini – Supervisor bullying at uOttawa case updates
The case for policy reform: Tyranny
The trouble with uOttawa Prof. A. Vellino
The ugly truth about uOttawa Prof. Liam Peyton
uOttawa engineering supervisor bullying scandal
uOttawa President Jacques Frémont ignores university bullying problem
uOttawa Prof. Liam Peyton denies academic support to postdoc
Updated uOttawa policies and regulations: A power grab
What you must know about uOttawa Prof. Rocci Luppicini
Why a PhD from uOttawa may not be worth the paper it’s printed on
Why uOttawa Prof. Andre Vellino refused academic support to postdoc