Coursera Google Data Analytics Professional Certificate Course 2 – Ask Questions to Make Data-Driven Decisions quiz answers to all weekly questions (weeks 1 – 4):
- Week 1: Effective questions
- Week 2: Data-driven decisions
- Week 3: More spreadsheet basics
- Week 4: Always remember the stakeholder
- Course challenge
You may also be interested in Google Data Analytics Professional Certificate Course 1: Foundations – Cliffs Notes.
Google Data Analytics Professional Certificate quiz answers
Google Data Analytics Professional Certificate Course 1: Foundations – Cliffs Notes
Google Data Analytics Professional Certificate Course 3: Prepare Data – quiz answers
Google Data Analytics Professional Certificate Course 4: Process Data – quiz answers
Google Data Analytics Professional Certificate Course 5: Analyze Data – quiz answers
Google Data Analytics Professional Certificate Course 6: Share Data – quiz answers
Google Data Analytics Professional Certificate Course 7: Data Analysis with R – quiz answers
Google Data Analytics Professional Certificate Course 8: Capstone – quiz answers
Week 1: Asking effective questions
This course begins by talking about problem solving and some of the common types of business problems that data analysts help solve.
To do the job of a data analyst, you need to ask questions and problem-solve. In this part of the course, you’ll check out some common analysis problems and how analysts solve them. You will also learn about effective questioning techniques that can help guide your analysis.
Learning Objectives
- Explain the characteristics of effective questions with reference to the SMART framework
- Discuss the common types of problems addressed by a data analyst
- Explain how each step of the problem-solving roadmap contributes to common analysis scenarios
- Explain the data analysis process, making specific reference to the ask, prepare, process, analyze, share, and act phases
- Describe the key ideas associated with structured thinking including the problem domain, scope of work, and context
1.1. Problem solving and effective questioning
Problem solving begins with asking effective questions.
<In the ask step, we define the problem we’re solving and make sure that we fully understand stakeholder expectations.>
1.2. Take action with data
1.2.1. Data in action (the data analysis process)
A short data analytics case study shows how the six phases of data analysis can be applied to effective problem solving of real world problems: “Anywhere Gaming Repair” is a small business service provider that comes to you to fix your broken video game systems or accessories. “The owner wanted to expand his business. He knew advertising as a proven way to get more customers, but he wasn’t sure where to start”–esp. regarding a) suitable media (so, who is the target audience and what media does it use?), and 2) the advertising budget (how much different advertising methods will cost). The business owner ask a data analyst, Maria, to make a recommendation.
Step 1: Maria begins by defining the problem that needed to be solved–via collaboration with stakeholders and understanding their needs.
Anywhere Gaming Repair wants to figure out how to bring in new customers. So the problem is how to determine the best advertising method for its target audience. Collected data will answer this problem.
Step 2: Next step was the prepare phase, Maria collected data for the upcoming analysis process.
First she needed to better understand the company’s target audience, i.e., people with video game systems. After that, Maria collected data on the different advertising methods … to determine which was the most popular one with the company’s target audience.
Here a data analyst is trying to understand their target audience. <They’re asking questions such as, “How can learning more about my target audience help me figure out how to solve this problem?” and “What research do I need to do about my target audience?”>
Step 3: Then she moved on to the process step. Here Maria cleaned the data to eliminate any errors or inaccuracies or inconsistencies “that could get in the way of the result … when you clean data, you transform it into a more useful format, create more complete information and remove outliers.”
Here an analyst asks questions such as, <“What data errors might get in the way of my analysis?” or “How can I clean my data so the information I have is consistent?”>
Step 4: Then it was time to analyze. In this step, Maria wanted to find out two things.
First, who’s most likely to own a video gaming system? (People between the ages of 18 and 34.) Second, where are these people most likely to see an advertisement? (TV commercials and podcasts are very popular with people in the target audience.)
Step 5: Next it is time for Maria to share her recommendation so the company could make a data-driven decision. “She summarized her results using clear and compelling visuals of the analysis. This helped her stakeholders understand the solution to the original problem.”
Step 6: Finally, Anywhere Gaming Repair took action, they worked with a local podcast production agency to create a 30 second ad about their services. The ad ran on podcast for a month, and it worked. They saw an increase in customers after just the first week. By the end of week 4, they had 85 new customers.
1.2.2. From issue to action: The six data analysis phases
1.2.3. How the data analysis process works (example/short case study): “One of the problems that we’ve tackled here at Google is our Noogler onboarding program, which is how we onboard new hires.”
<One of the things that we’ve done is ask the question, how do we know whether or not Nooglers are onboarding faster through our new onboarding program than our old onboarding program where we used to lecture them. We worked really closely with the content providers to understand just exactly what does it mean to onboard someone faster?
<Once we asked all the questions … we prepared the data by understanding who was the population of the new hires that we were examining … who our sample set was, who our control group was, who our experiment group was, where were our data sources, and make sure that it was in a set, in a format that was clean and digestible for us to write the proper scripts for.
<So the next step for us was to process the data to make sure that it was in a format that we could actually analyze in SQL, making sure that was in the right format, in the right columns, and in the right tables for us.
<To analyze the data, we wrote scripts in SQL and in R to correlate the data to the control group or the experiment group and interpret the data to understand, were there any changes in the behavioral indicators that we saw?
<Once we analyze all the data, we want to report on it in a way that our stakeholders could understand … we prepared reports, dashboards and presentations, and shared that information out.
<Once all of our reports were complete, we saw really positive results and decided to act on it by continuing our project-based learning onboarding program.>
1.3. Solve problems with data
Data analysts work with six basic problem types:
- Making predictions (e.g., a company that wants to know the best advertising method to bring in new customers, e.g., Anywhere Gaming Repair);
- Categorizing things (e.g., a data analyst identifying and classifying keywords from customer reviews to improve customer satisfaction);
- Spotting something unusual (e.g., a company that sells smart watches that help people monitor their health, e.g., resting heartbeat rate suddenly spikes to 120 beats per minute);
- Identifying themes (insights are grouped into broader themes, e.g., usability improvement projects might require analysts to identify themes to help prioritize the right product features for improvement);
- Discovering connections (e.g., a third-party logistics company working with another company to get shipments delivered to customers on time);
- Finding patterns (in historical data, e.g., minimizing downtime caused by machine failure).
1.4. Craft effective questions
We’re going to learn how to craft effective questions that lead to key insights you can use to solve all kinds of problems using the SMART framework, and how to ensure that your questions are fair and objective.
To start solving a problem, data analysts start by asking effective questions. Effective questions can be crafted following the SMART methodology.
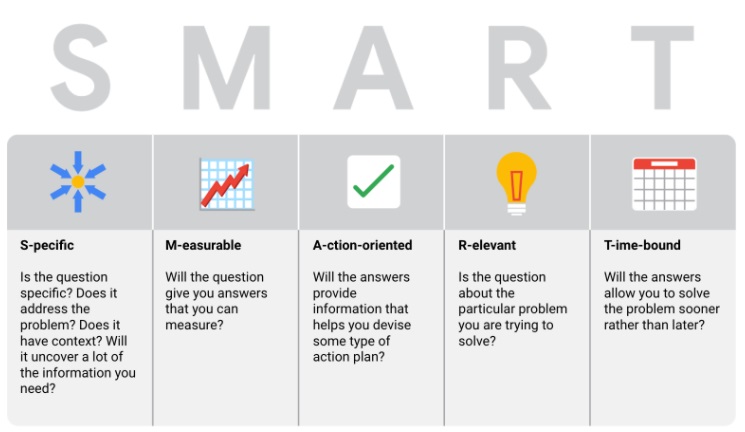
That means they’re specific, measurable, action-oriented, relevant, and time-bound.
Specific questions are simple, significant and focused on a single topic or a few closely related ideas (e.g., what percentage of kids achieve the recommended 60 minutes of physical activity at least five days a week? What are the top five features you would like to see in a car package?)
Measurable questions can be quantified and assessed (e.g., how many times was our video shared on social channels the first week it was posted? On a scale of 1-10 with 10 being the most important how important is your car having four-wheel drive?)
Action-oriented questions encourage change (e.g., what design features will make our packaging easier to recycle?)
Relevant questions matter, are important and have significance to the problem you’re trying to solve (e.g., What are the top five features you would like to see in a car package?)
Time-bound questions specify the time to be studied (e.g., 1983 to 2004; Has four-wheel drive become more or less popular in the last three years?)
Questions “should be open-ended. This is the best way to get responses that will help you accurately qualify or disqualify potential solutions to your specific problem.”
Questions should be fair. Questions don’t create or reinforce bias. “Fairness also means crafting questions that make sense to everyone. Questions are clear and have a straightforward wording that anyone can easily understand.” Unfair questions include leading questions (this product is great, isn’t it?), and questions that makes assumptions (what do you love most about our exhibits?)
Answers to week 1 quiz questions
Diagnostic quiz
Question 1
Categorizing things is one of the six problem types data analysts solve. This type of problem might involve which of the following actions?
- Classifying or grouping items
- Using data to envision how something might happen in the future
- Noticing something outside of the ordinary
- Analyzing how one action leads to or affects another
Categorizing things involves classifying or grouping items in order to gain insights.
Question 2
Finding patterns is one of the six problem types data analysts aim to solve. This type of problem might involve which of the following?
- Taking categorized items and grouping them into broader topic areas
- Noticing something outside of the ordinary
- Analyzing how one action leads to or affects another
- Identifying trends from historical data
Finding patterns involves identifying trends from historical data.
Question 3
In the SMART methodology, questions that encourage change are described how?
- Relevant
- Specific
- Time-bound
- Action-oriented
Action-oriented questions encourage change.
Question 4
Fill in the blank: In data analytics, qualitative data _. Select all that apply.
- measures numerical facts
- measures qualities and characteristics
- is specific
- is subjective
Qualitative data is subjective and measures qualities and characteristics.
Question 5
In data analytics, how are dashboards different from reports?
- Dashboards contain static data. Reports contain data that is constantly changing.
- Dashboards are used to share updates with stakeholders only periodically. Reports give stakeholders continuous access to data.
- Dashboards provide a high level look at historical data. Reports provide a more detailed look at live, interactive data.
- Dashboards monitor live, incoming data from multiple datasets and organize the information into one central location. Reports are static collections of data.
Dashboards monitor live, incoming data from multiple datasets and organize the information into one central location. Reports are static collections of data.
Question 6
Small data differs from big data in what ways? Select all that apply.
- Small data focuses on short, well-defined time periods. Big data focuses on change over a long period of time.
- Small data is typically stored in a database. Big data is typically stored in a spreadsheet.
- Small data is effective for analyzing day-to-day decisions. Big data is effective for analyzing more substantial decisions.
- Small data involves datasets concerned with a small number of specific metrics. Big data involves datasets that are larger and less specific.
Small data involves a small number of specific metrics over a shorter period of time. It’s effective for analyzing day-to-day decisions. Big data involves larger and less specific datasets and focuses on change over a long period of time. It’s effective for analyzing more substantial decisions.
Question 7
Fill in the blank: Some of the most common symbols used in formulas include + (addition), – (subtraction), * (multiplication), and / (division). These are called _.
- references
- operators
- counts
- domains
Operators are symbols used in formulas, including + (addition), – (subtraction), * (multiplication), and / (division).
Question 8
In the function =SUM(G1:G35), identify the range.
- G1:G35
- =SUM
- G35
- =SUM(G1)
In the function =SUM(G1:G35), the range is G1:G35. A range is a collection of two or more cells.
Question 9
To address a vague, complex problem, a data analyst breaks it down into smaller steps. They use a process to help them recognize the current problem or situation, organize available information, reveal gaps and opportunities, and identify options. What does this scenario describe?
- Gap analysis
- Structured thinking
- Data-driven decision-making
- Analytical thinking
Structured thinking is the process of recognizing the current problem or situation, organizing available information, revealing gaps and opportunities, and identifying the options.
Question 10
Asking questions including, “Does my analysis answer the original question?” and “Are there other angles I haven’t considered?” enable data analysts to accomplish what tasks? Select all that apply.
- Identify primary and secondary stakeholders
- Use data to get to a solid conclusion
- Help team members make informed, data-driven decisions
- Consider the best ways to share data with others
Data analysts ask thoughtful questions to help them reach solid conclusions, consider how to share data with others, and help team members make effective decisions.
Video: Data in action
Marketing analytics is the process of measuring, analyzing, and managing a company’s marketing strategy and budget. Often, this involves identifying the company’s target audience.
The target audience includes which people?
- The people who hold a stake in the marketing analytics project
- The people the company is trying to reach
- The people most likely to listen to podcasts
- The people on your marketing analytics team
The target audience is the people the company is trying to reach.
Video: Common problem types
The finding patterns problem type could involve which of the following actions?
- Reviewing social media reviews to identify common phrases, categorize them, and group each category into a broader theme
- Using historical data to create a report that shows when sales are likely to pick up during the upcoming holiday season
- Reviewing sales data and noticing that a random Tuesday in August had the highest sales last year
- Collaborating with a supplier to discover that bad weather is the most common reason for late deliveries
The finding patterns problem type could involve using historical data to create a report that shows when sales are likely to pick up during the upcoming holiday season. This problem type deals with looking at trends in historical data to understand what happened in the past and, therefore, is likely to happen again in the future.
Video: SMART questions
Questions leading to answers that can be quantified and assessed align with which component of the SMART methodology?
- Tangible
- Reasonable
- Appropriate
- Measurable
Questions leading to answers that can be quantified and assessed align with the measurable component of the SMART methodology.
While considering a research question, a data analyst follows the SMART methodology. They limit their analysis to include data from July 2012 to August 2012. What component of the SMART framework describes this decision?
- Thoughtful
- Targeted
- Topical
- Time-bound
Limiting analysis to a certain time period describes time-bound questions. They help limit the range of analysis possibilities and enable data analysts to focus on the most relevant data.
Take action with data
Question 1
A data analytics team works to recognize the current problem. Then, they organize available information to reveal gaps and opportunities. Finally, they identify the available options. These steps are part of what process?
- Using structured thinking
- Categorizing things
- Making connections
- Applying the SMART methodology
This describes structured thinking. Structured thinking begins with recognizing the current problem or situation. Next, information is organized to reveal gaps and opportunities. Finally, the available options are identified.
Question 2
In which step of the data analysis process would an analyst ask questions such as, “What data errors might get in the way of my analysis?” or “How can I clean my data so the information I have is consistent?”
- Ask
- Process
- Prepare
- Analyze
An analyst asks questions such as, “What data errors might get in the way of my analysis?” or “How can I clean my data so the information I have is consistent?” during the process step. This is when data is cleaned in order to eliminate any possible errors, inaccuracies, or inconsistencies.
Question 3
A data analyst has entered the analyze step of the data analysis process. Identify the questions they might ask during this phase. Select all that apply.
- What story is my data telling me?
- How can I create an engaging presentation to stakeholders?
- How will my data help me solve this problem?
- What is the question I’m trying to answer?
The analyze step involves thinking analytically about data. Data analysts might ask how the data can help them solve the problem and what story the data is trying to tell.
Question 4
A data analyst is trying to understand their target audience. They’re asking questions such as, “How can learning more about my target audience help me figure out how to solve this problem?” and “What research do I need to do about my target audience?” The data analyst is in which phase of the data analysis process?
- Act
- Share
- Ask
- Prepare
The data analyst is in the prepare step. This is when analysts consider what information to gather and what research they can do to help problem-solve.
Solve problems with data
Question 1
A data analyst identifies keywords from customer reviews and labels them as positive or neutral. This an example of which problem type?
- Finding patterns
- Making predictions
- Identifying themes
- Categorizing things
A data analyst identifying keywords from customer reviews and labeling them as positive or neutral is an example of categorizing things.
Question 2
The spotting something unusual problem type could involve which of the following scenarios?
- A data analyst at an arts nonprofit classifies similar data points into groups for further analysis.
- A data analyst working for an agricultural company examines why a dataset has a surprising and rare data point.
- A data analyst at a clothing retailer creates a list of common topics, categorizes them, and groups each category into a broader subject area for further analysis.
- A data insight helps a landscaping company envision what will happen in the future
The problem type of spotting something unusual could involve a data analyst examining why a dataset has a surprising and rare data point. Spotting something unusual deals with identifying and analyzing something out of the ordinary.
Question 3
A data analyst at an online retailer looks at trends in historical sales data. They want to understand what happened in the past and, therefore, is likely to happen again in the future. This an example of which problem type?
- Finding patterns
- Making predictions
- Categorizing things
- Identifying themes
A data analyst looking at trends in historical sales data to understand what happened in the past and, therefore, is likely to happen again in the future is an example of finding patterns. Finding patterns deals with looking at trends in historical data to understand what happened in the past and, therefore, is likely to happen again in the future.
Craft effective questions
Question 1
A data analyst uses the SMART methodology to create a question that encourages change. This type of question can be described how?
- Results-focused
- Stimulating
- Motivational
- Action-oriented
In the SMART methodology, questions that encourage change are action-oriented.
Question 2
A time-bound SMART question specifies which of the following parameters?
- The topic or subject of the analysis
- The desired change the analysis should produce
- The metrics or measures related to the analysis
- The era, phase, or period of analysis
A time-bound SMART question specifies the era, phase, or period of analysis.
Question 3
A data analyst working for a mid-sized retailer is writing questions for a customer experience survey. One of the questions is: “Do you prefer online or in-store?” Then, they rewrite it to say: “Do you prefer shopping at our online marketplace or shopping at your local store?” Describe why this is a more effective question.
- The first question is leading, whereas the second question could have many different answers.
- The first question is closed-ended, whereas the second question encourages the respondent to elaborate.
- The first question is vague, whereas the second question includes important context.
- The first question contains slang that might not make sense to everyone, whereas the second question is easily understandable.
Vague questions do not provide context. The second question clarifies that the data analyst wants to learn exactly how and where customers prefer to shop.
Question 4
A data analyst at a social media company is creating questions for a focus group. They use common abbreviations such as PLS for “please” and LMK for “let me know.” This is fair because the participants use social media a lot and are likely to be technically savvy.
- True
- False
Fairness means asking questions that make sense to everyone. Even if a data analyst suspects people will understand abbreviations, slang, or other jargon, it’s important to write questions with simple wording.
Weekly challenge 1
Question 1
Structured thinking involves which of the following processes? Select all that apply.
- Organizing available information
- Recognizing the current problem or situation
- Asking SMART questions
- Revealing gaps and opportunities
Structured thinking involves recognizing the current problem or situation, organizing available information, revealing gaps and opportunities, and identifying the options.
Question 2
The prepare step of the data analysis process involves defining the problem you’re trying to solve and understanding stakeholder expectations.
- True
- False
The ask step involves defining the problem you’re trying to solve and understanding stakeholder expectations.
Question 3
The share phase of the data analysis process typically involves which of the following activities? Select all that apply.
- Putting analysis into action to solve a problem
- Creating a slideshow to present to stakeholders
- Summarizing results using data visualizations
- Communicating findings
The share phase of the data analysis process typically involves communicating findings, summarizing results using data visualizations, and creating a slideshow to present to stakeholders.
Question 4
A garden center wants to attract more customers. A data analyst in the marketing department suggests advertising in popular landscaping magazines. This is an example of what practice?
- Developing a data analytics case study
- Collecting customer information
- Monitoring social media feedback
- Reaching your target audience
This is an example of reaching your target audience. In this scenario, people who read landscaping magazines are the target audience because they’re likely to be interested in shopping at the garden center.
Question 5
A data analyst is working for a local power company. Recently, many new apartments have been built in the community, so the company wants to determine how much electricity it needs to produce for the new residents in the future. A data analyst uses data to help the company make a more informed forecast. This is an example of which problem type?
- Spotting something unusual
- Discovering connections
- Identifying themes
- Making predictions
This is an example of making predictions. Making predictions deals with making informed decisions about how things may be in the future.
Question 6
Describe the key difference between the problem types of categorizing things and identifying themes.
- Categorizing things involves determining how items are different from each other. Identifying themes brings different items back together in a single group.
- Categorizing things involves assigning items to categories. Identifying themes takes those categories a step further, grouping them into broader themes.
- Categorizing things involves assigning grades to items. Identifying themes involves creating new classifications for items.
- Categorizing things involves taking inventory of items. Identifying themes deals with creating labels for items.
Categorizing things involves assigning items to categories. Identifying themes takes those categories a step further, grouping them into broader themes.
Question 7
Which of the following examples are closed-ended questions? Select all that apply.
- What are your thoughts about math?
- Is math your favorite subject?
- What grade did you get in your math class?
- How old are you?
Closed-ended questions don’t encourage people to elaborate and share valuable details.
Question 8
The question, “Why don’t our employees complete their timesheets each Friday by noon?” is not action-oriented. Which of the following questions are action-oriented and more likely to lead to change? Select all that apply.
- What functionalities would make our timesheet web page more user-friendly?
- What features could we add to our calendar app as a weekly timesheet reminder to employees?
- Why don’t employees prioritize filling out their timesheets by noon on Fridays?
- How could we simplify the time-keeping process for our employees?
These questions are action-oriented. That means they’re more likely to result in specific answers that can be acted on to lead to change.
Question 9
In the SMART methodology, time-bound questions are simple, significant, and focused on a single topic or a few closely related ideas.
- True
- False
In the SMART methodology, specific questions are simple, significant, and focused on a single topic or a few closely related ideas.
Question 10
Which of the following questions make assumptions? Select all that apply.
- It must be frustrating waiting on hold for so long, right?
- Wouldn’t you agree that product A is better than product B?
- Did you get through to customer service?
- Keeping employees engaged is important, isn’t it?
A common example of an unfair question is one that makes assumptions. Unfair questions assume the respondent’s answer to the question.
Week 2: Making data-driven decisions
Next, we’ll explore data of all kinds and its impact on decision making and learn how to share data through reports and dashboards.
In analytics, data drives decision making. In this part of the course, you’ll explore data of all kinds and its impact on decision making. You’ll also learn how to share your data through reports and dashboards.
Learning Objectives
- Discuss the use of data in the decision-making process
- Compare and contrast data-driven decision making with data-inspired decision making
- Explain the difference between quantitative and qualitative data including reference to their use and specific examples
- Discuss the importance and benefits of dashboards and reports to the data analyst with reference to Tableau and spreadsheets
- Differentiate between data and metrics, giving specific examples
- Demonstrate an understanding of what is involved in using a mathematical approach to analyze a problem
2.1. Learn about data driven decisions
2.2. Understand the power of data
2.3. Follow the evidence
2.4. Connecting the data dots
Answers to week 2 quiz questions
Video: How data empowers decisions
Fill in the blank: Data-inspired decision-making explores different data sources to find _.
- outlier
- problems
- commonalities
- predictions
Data-inspired decision-making explores different data sources to find commonalities.
Video: Qualitative and quantitative data
Fill in the blank: Quantitative data is specific and _.
- objective
- subjective
- explanatory
- descriptive
Quantitative data is a specific and objective measure, such as a number, quantity or range.
Which of the following examples would be determined using qualitative data?
- The annual rainfall in Costa Rica
- The number of commuters who take the train to work
- The frequency of hurricanes per year in Louisiana
- The most well-liked make and model of car in Puerto Rico
The most well-liked make and model of car in Puerto Rico would be determined using qualitative data. Qualitative data is a subjective and explanatory measure of a quality or characteristic.
Video: The big reveal: Sharing your findings
A dashboard would be most beneficial for which of the following scenarios?
- A project manager needs to monitor data as it becomes available.
- An analyst needs a summary of data upon request.
- A consultant needs all historical data for an audit.
- A cross functional team needs an ad-hoc update.
A dashboard would be useful for monitoring data as it becomes available.
Understand the power of data
Question 1
What is the difference between qualitative and quantitative data?
- Qualitative data describes the kind of data being analyzed. Quantitative data describes how much data is being analyzed.
- Qualitative data is specific. Quantitative data is subjective.
- Qualitative data is about the quality of a product or service. Quantitative data is about how much of that product or service is available.
- Qualitative data can be used to measure qualities and characteristics. Quantitative data can be used to measure numerical facts.
Qualitative data can be used to measure qualities and characteristics. Quantitative data can be used to measure numerical facts.
Question 2
Fill in the blank: Data-inspired decision-making deals with exploring different data sources to find out _.
- how they can drive business decisions
- if they are based on facts or opinions
- what they have in common
- how they have changed over time
Data-inspired decision-making deals with exploring different data sources to find out what they have in common.
Question 3
Which of the following examples describes using data to achieve business results? Select all that apply.
- A large retailer performs data analysis on product purchases to create better promotions.
- A movie theater tracks the number of weekend movie goers for three months.
- A grocery chain collects data on sale items and pricing from each store.
- A video streaming service analyzes user preferences to customize movie recommendations.
Analyzing user preferences to customize movie recommendations and analyzing product purchases to create better promotions are examples of using data to achieve business results. They go beyond collecting data and use analysis to gain insights.
Question 4
If someone is describing their feelings or emotions, it is qualitative data.
- True
- False
Qualitative data is descriptive, subjective, and explanatory.
Follow the evidence
Question 1
Fill in the blank: Pivot tables in data processing tools are used to _ data.
- populate
- clean
- validate
- summarize
Pivot tables are used to summarize data.
Question 2
In data analytics, how are dashboards different from reports?
- Dashboards contain static data. Reports contain data that is constantly changing.
- Dashboards monitor live, incoming data from multiple datasets and organize the information into one central location. Reports are static collections of data.
- Dashboards are used to share updates with stakeholders only periodically. Reports give stakeholders continuous access to data.
- Dashboards provide a high-level presentation of historical data. Reports provide a more detailed presentation of live, interactive data.
Dashboards monitor live, incoming data from multiple datasets and organize the information into one central location. Reports are static collections of data.
Question 3
Describe the difference between data and metrics.
- Data can be used for measurement. Metrics cannot be used for measurement.
- Data is quantifiable. Metrics are unquantifiable.
- Data is a collection of facts. Metrics are quantifiable data types used for measurement.
- Data is quantifiable and used for measurement. Metrics are unorganized collections of facts.
Data is a collection of facts. Metrics are quantifiable data types used for measurement.
Question 4
Return on Investment (ROI) uses which of the following metrics in its definition?
- Profit and investment
- Supply and demand
- Sales and margin
- Inventory and units
Return on Investment (ROI) = Profit/Investment.
Connecting the data dots
Question 1
Describe the key differences between small data and big data. Select all that apply.
- Small data is effective for analyzing day-to-day decisions. Big data is effective for analyzing more substantial decisions.
- Small data involves datasets concerned with a small number of specific metrics. Big data involves datasets that are larger and less specific.
- Small data focuses on short, well-defined time periods. Big data focuses on change over a long period of time.
- Small data is typically stored in a database. Big data is typically stored in a spreadsheet.
Small data involves a small number of specific metrics over a shorter period of time. It’s effective for analyzing day-to-day decisions. Big data involves larger and less specific datasets and focuses on change over a long period of time. It’s effective for analyzing more substantial decisions.
Question 2
Which of the following is an example of small data?
- The bed occupancy rate for a hospital for the past decade
- The trade deficit between two countries over a hundred years
- The total absences of all high school students
- The number of steps someone walks in a day
The number of steps someone walks in a week is an example of small data.
Question 3
The amount of exercise time to burn a minimum of 400 calories is a problem that requires big data.
- True
- False
This problem can be solved using small data. It contains a specific metric (400 calories) and a short, defined period of time (amount of exercise time).
Weekly challenge 2
Question 1
Fill in the blank: In data analytics, a process or set of rules to be followed for a specific task is _.
- an algorithm
- a domain
- a pattern
- a value
In data analytics, a process or set of rules to be followed for a specific task is an algorithm.
Question 2
Fill in the blank: In data analytics, qualitative data _. Select all that apply.
- measures numerical facts
- measures qualities and characteristics
- is always time bound
- is subjective
In data analytics, qualitative data is subjective and measures qualities and characteristics.
Question 3
In data analytics, reports use live, incoming data from multiple datasets; dashboards use static collections of data.
- True
- False
Dashboards monitor live, incoming data from multiple datasets; reports use static collections of data.
Question 4
A pivot table is a data-summarization tool used in data processing. Which of the following tasks can pivot tables perform? Select all that apply.
- Group data
- Calculate totals from data
- Clean data
- Reorganize data
Pivot tables are used to reorganize, group, and calculate totals from data.
Question 5
A metric is a single, quantifiable type of data that can be used for what task?
- Defining a problem type
- Setting and evaluating goals
- Sorting and filtering data
- Cleaning data
A metric is a single, quantifiable type of data used when setting and evaluating goals.
Question 6
Fill in the blank: A _ goal is measurable and evaluated using single, quantifiable data.
- metric
- finite
- benchmark
- conceptual
A metric goal is measurable and evaluated using single, quantifiable data.
Question 7
If a data analyst compares the cost of an investment to the net profit of that investment over a period of time, they’re analyzing the investment scope.
- True
- False
If a data analyst compares the cost of an investment to the net profit of that investment over a period of time, they’re analyzing the return on investment.
Question 8
Fill in the blank: A data analyst is using data to address a large-scale problem. This type of analysis would most likely require _. Select all that apply.
- small data
- data that reflects change over time
- data represented by a limited number of metrics
- big data
A data analyst using data to address a large-scale problem would most likely require big data that reflects change over time.
Week 3: Learning spreadsheet basics
Next, we will explore spreadsheets further and discover how they can help make data analysis even more effective, and we’ll start learning about structured thinking and how structured thinking can help analysts better understand business problems and come up with solutions.
Spreadsheets are an important data analytics tool. In this part of the course, you will learn both why and how data analysts use spreadsheets in their work. You will also explore how structured thinking can help analysts better understand problems and come up with solutions.
Learning Objectives
- Describe the key ideas associated with structured thinking including the problem domain, scope of work, and context
- Compare formulas and functions with reference to similarities and differences
- Demonstrate an understanding of the use of formulas in spreadsheets including a definition and specific examples
- Demonstrate the use of spreadsheets to complete basic tasks of the data analyst including entering and organizing data
- Discuss the data analyst’s use of spreadsheets with reference to roles and responsibilities
3.1. Introduction to spreadsheets
3.2. Working with spreadsheets
3.3. Using formulas in spreadsheets
3.4. Using functions in spreadsheets
3.5. Save time with structured thinking
Answers to week 3 quiz questions
Video: Get to work with spreadsheets
To perform calculations in a spreadsheet, data analysts use formulas and functions.
- False
- True
To perform calculations in a spreadsheet, data analysts use formulas and functions, such as SUM, AVERAGE, and COUNT.
Video: Formulas for success
In spreadsheets, what is the term for the symbols used in formulas to perform a specific calculation?
- References
- Attributes
- Tables
- Operators
In spreadsheets, the symbols used in a formula to perform a specific calculation are called operators.
Video: Functions 101
Which of the following are functions? Select all that apply.
- COUNT
- SUM
- START
- MAX
SUM, COUNT, and MAX are functions. A function is a preset command that automatically performs a specific process or task using data
Video: Scope of work and structured thinking
What process do data analysts use to recognize the current situation, organize information, and identify options?
- Troubleshooting
- Brainstorming
- Casual observation
- Structured thinking
Data analysts use structured thinking to recognize the current situation, organize information, and identify opportunities.
Microsoft Excel resources
- Excel Quick Start Guide
- Excel video training
- Sort data in a range or table
- Filter data in a range or table
- Format a worksheet
- Microsoft’s Guidelines for organizing and formatting data on a worksheet
Google Sheets resources
- Google Sheets cheat sheet
- Create and Import files
- Sort and filter data
- Edit and format a spreadsheet
- Differences between Sheets and Excel
Working with spreadsheets
Question 1
To sort and filter the data in a spreadsheet, data analysts must use multiple formulas.
- True
- False
To sort and filter the data in a spreadsheet, data analysts use the sort and filter spreadsheet tools.
Question 2
Which time-saving tool do data analysts use to organize data and perform calculations?
- Calculator
- Paper
- Spreadsheet
- Graph
Data analysts use spreadsheets to organize data and perform calculations.
Question 3
Within a spreadsheet, data analysts use which tools to save time and effort by automating commands? Select all that apply.
- Tables
- Filters
- Functions
- Formulas
Data analysts use formulas and functions to save time and effort by automating commands.
Using formulas in spreadsheets
Question 1
Which of the following are examples of operators used in formulas? Select all that apply.
1 / 1 point
- Hyphen (-)
- Forward slash (/)
- Asterisk (*)
- Plus-minus (±)
The asterisk, hyphen, and forward slash are examples of operators used in formulas.
Question 2
In a spreadsheet, a function should always start with which of the following operators?
- Dash (—)
- Plus-minus (±)
- Equal sign (=)
- Colon (:)
In a spreadsheet, a function should always start with an equal sign.
Question 3
What is the term for the set of cells that a data analyst selects to include in a formula?
- Cell domain
- Data boundary
- Cell set
- Data range
The set of cells a data analyst selects to include in a formula is called the data range.
Question 4
In a formula, the plus sign (+) is the operator for addition, and the plus-minus (±) is the operator for subtraction.
- True
- False
In a formula, the plus sign is the operator for addition and the hyphen is the operator for subtraction.
Question 5
If the cells in a spreadsheet contain anything other than numbers, which of the following errors might occur?
- #NAME?
- #DIV/0!
- #VALUE!
- #MIN/5!
If the cells in a spreadsheet contain anything other than numbers, you might see the the #VALUE! error.
Using functions in spreadsheets
Question 1
Data analysts use which of the following functions to quickly perform calculations in a spreadsheet? Select all that apply.
- MIN
- AVERAGE
- MASS
- SUM
AVERAGE, MIN, and SUM are functions used to quickly perform calculations in a spreadsheet.
Question 2
What is the term for a preset command in a spreadsheet?
- Range
- Quotient
- Function
- Cell
A preset command in a spreadsheet is called a function.
Question 3
You are working with spreadsheet data about a cross-country relay race. Each runner’s times are located in cells H2 through H28. To find the runner with the fastest time, what is the correct MIN function syntax? Type your answer below.
=MIN(H2:H28)Feedback: The MIN function syntax is =MIN(H2:H28). MIN returns the smallest numeric value from a range of cells. H2:H28 is the specified range.
Question 4
A data analyst at an electronics company needs to compare earnings of the four departments of the company over time. They collect the earning data of each unit for the previous three years and create a visualization. Which type of visualization would be most effective?
- Line graph
- Scatterplot
- Pie chart
- Infographic
A line graph would be most effective for visualizing change over time and comparing groups of data.
Question 5
To visualize data, data analysts use which of the following graphs or charts? Select all that apply.
- Bar graph
- Area chart
- Feature graph
- String chart
Bar graphs and area charts are used for data visualization.
Save time with structured thinking
Question 1
Fill in the blank: In order to save time and money, a data analyst defines the _ at the start of a project. Select all that apply.
- timeline
- problem domain
- key milestones
- solution
In order to save time and money, a data analyst defines the problem domain, key milestones, and timeline at the start of a project.
Question 2
The outline used to define a data analyst’s contribution to a project is called what?
- Action plan
- Scope of work
- To-do list
- Diagram
The outline used to define a data analyst’s contribution to a project is called the scope of work.
Question 3
To address a vague, complex problem, data analysts break it down into smaller steps. They use a process that helps them recognize the current problem or situation. Then, they organize available information, reveal gaps and opportunities, and identify the options. What process does this scenario describe?
- Structured thinking
- Analytical thinking
- Gap analysis
- Data-driven decision-making
This describes structured thinking. Structured thinking is the process of recognizing the current problem or situation, organizing available information, revealing gaps and opportunities, and identifying the options. In this process, you address a vague, complex problem by breaking it down into smaller steps, and then those steps lead you to a logical solution.
Weekly challenge 3
Question 1
Both formulas and functions in spreadsheets begin with what symbol?
- Vertical line (|)
- Equals sign (=)
- Plus-minus sign (±)
- Lowercase x
Both formulas and functions in spreadsheets begin with an equals sign.
Question 2
Attributes are used in spreadsheets for what purpose?
- Label the data in each column
- Insert data into each column
- Analyze the data in a row
- Add a new column
Attributes are used to label the type of data in each column in a spreadsheet.
Question 3
Which of the following tasks might be performed using spreadsheets?
- Land a new client
- Develop communication skills
- Maintain information about accounts
- Write a sales pitch
A spreadsheet could be used to maintain information about accounts.
Question 4
Fill in the blank: Combining formulas and functions enables the function to run based on a _ set by the formula.
- change
- cell
- count
- criteria
Combining formulas and functions enables the function to run based on a criteria set by the formula.
Question 5
Which of the following statements describes a key difference between formulas and functions?
- Formulas are used in graphs, and functions are not.
- Formulas span two or more cells, and functions exist in only one cell.
- Formulas contain words and numbers, and functions contain numbers only.
- Formulas are written by the user, and functions are already defined.
Formulas are written by the user, and functions are already defined.
Question 6
Fill in the blank: Putting data into context helps data analysts eliminate _.
- fairness
- intolerance
- labels
- bias
Putting data into context helps data analysts eliminate bias.
Question 7
Defining the problem domain is part of which data analytics process?
- Balanced thinking
- Logical thinking
- Organized thinking
- Structured thinking
Defining the problem domain is part of the structured-thinking process.
Question 8
A data analyst uses structured thinking to recognize the current problem or situation. Select the final step to structured thinking.
- Identify options
- Monitor options
- Clean data
- Sort data
The final step in the structured-thinking process is to identify options.
Week 4: Always remember the stakeholder
Finally, we’ll learn some proven strategies for managing the expectations of stakeholders while establishing clear communication with team members to achieve our objectives.
Successful data analysts learn to balance needs and expectations. In this part of the course, you’ll learn strategies for managing the expectations of stakeholders while establishing clear communication with your team to achieve your objectives.
Learning Objectives
- Discuss communication best practices for the data analyst including reference to office communication, conflict resolution, facilitating meetings, and status reports
- Discuss the importance of focus on stakeholder expectations
- Identify common limitations with data, with specific reference to speed versus accuracy and responding to time-sensitive requests
4.1. Learn about communication best practices
4.2. Balance team and stakeholder needs
4.3. Communication is key
4.4. Recognizing data limitations
4.5. Optional -The workplace secret sauce, teamwork
Answers to week 4 quiz questions
Balance team and stakeholder needs
Question 1
As a data analyst, it’s important to communicate often. Sharing detailed notes, creating reports, and using a changelog are all ways to communicate with the people who have invested time and resources in a project. Who are these people?
- Executives
- Customer-facing team
- Stakeholders
- Subject-matter experts
Stakeholders invest time and resources into a project. Sharing detailed notes, creating reports, and using a changelog are all useful ways to keep them up-to-date.
Question 2
The customer-facing team does which of the following activities? Select all that apply.
- Share customer feedback
- Compile information about customer expectations
- Tell the data story to others
- Provide operational leadership for the company
The customer-facing team compiles information, shares feedback, and sets expectations.
Question 3
The human resources director approaches a data analyst to propose a new data analysis project. The analyst has a lot of experience in human resources and believes the director is taking the wrong approach, and it will lead to some problems. Select the data analyst’s best course of action.
- Complete the project as requested, but set aside some time in the future to fix the problems that are sure to come up.
- Tell the director that they’re very sorry, but they can’t work on the project.
- Respectfully explain their viewpoints and offer the director some additional information to help improve the project.
- Politely explain that they’re too busy to take on another project at this time.
The analyst should respectfully explain their viewpoints and offer the director some additional information to help improve the project.
Communication is key
Question 1
To communicate clearly with stakeholders and team members, there are four key questions data analysts ask themselves. The first is: Who is my audience? Identify the remaining three questions. Select all that apply.
- Why are stakeholders and team members important?
- What does my audience need to know?
- What does my audience already know?
- How can I communicate effectively to my audience?
The four key questions data analysts ask themselves when communicating with stakeholders are: Who is my audience? What do they already know? What do they need to know? And how can I communicate effectively with them?
Question 2
You’re working on a data analysis project, and you run into an obstacle. You try to find a solution, but you’re having no luck, and now the project is going off schedule. The best course of action is to put in extra hours to keep looking for a solution, rather than bothering your team with the problem.
- True
- False
The best course of action is to ask your team for help. Taking initiative to solve problems is a great practice, but your team is an excellent resource if you find that you’re unable to find a solution by yourself.
Question 3
A colleague sent you a question via email nearly two days ago. You know it’s going to take a while for you to find the answer because you need to do some research first. You’re too busy to get it done today. What’s the best course of action?
- Reply with a quick update thanking the sender for their patience and letting them know when they can expect you to respond with the answer to their question.
- Forward the email to the entire data analytics team, and ask if someone else can answer the question for you.
- Delete the email. By the time you’re able to answer the question, it won’t be helpful information anyway.
- Respond right away with your best guess to the answer of their question. The sender has been waiting nearly 48 hours, and any response is better than nothing.
The best course of action is to reply with a quick update thanking the sender for their patience and letting them know when they can expect you to respond with the answer to their question.
Question 4
Focusing on stakeholder expectations enables data analysts to achieve what goals? Select all that apply.
- Improve communication among teams
- Build trust
- Understand project goals
- Multitask more effectively
Focusing on stakeholder expectations enables data analysts to understand project goals, improve communication, and build trust.
Question 5
Setting realistic stakeholder expectations at every stage of a project might involve which of the following tasks? Select all that apply.
- Preparing a report that shows stakeholders the pros and cons of an update to the project
- Creating a reasonable timeline and sharing it with stakeholders
- Keeping problems to yourself so stakeholders don’t have to worry about them
- Communicating to stakeholders any changes that may affect the analysis
Setting realistic stakeholder expectations might involve creating a reasonable timeline, communicating any changes that may affect analysis, and preparing a report that shows the pros and cons of a project update.
Recognize data limitations
Question 1
A stakeholder has asked a data analyst to produce a report very quickly. What are some strategies the analyst can apply to ensure their work isn’t rushed, answers the right question, and delivers useful results? Select all that apply.
- Reframe the question
- Work overtime to get the report done by the following day
- Set clear expectations about timeframe
- Outline the problem
To ensure their work answers the right questions and delivers useful results, the data analyst should set clear expectations, outline the problem, and reframe the question.
Question 2
If a sample size is too small, a few unusual responses can skew the results. To avoid this problem, data analysts aim to collect lots of data and chart trends over longer time periods.
- True
- False
If a sample size is too small, a few unusual responses can skew the results. To avoid this problem, data analysts aim to collect lots of data and chart trends over longer time periods.
Question 3
Asking questions including, “Does my analysis answer the original question?” and “Are there other angles I haven’t considered?” enable data analysts to accomplish what tasks? Select all that apply.
- Use data to get to a solid conclusion
- Help their team make informed, data-driven decisions
- Consider the best ways to share data with others
- Identify primary and secondary stakeholders
Asking questions such as these enables data analysts to consider the best ways to share data with others, help their team make informed decisions, and use data to get to a solid conclusion.
The workplace secret sauce, teamwork
Question 1
Your supervisor gives you a new data analysis project with unclear instructions, and you become frustrated trying to figure out how to proceed. Before moving forward, what should you do? Select all that apply.
- Go see your supervisor in person so they can clearly understand how stressed out you’re feeling.
- Do some additional research on your own to better understand the context of the request.
- Take a few minutes to calm down, then ask your supervisor more questions to learn about the big picture goals.
- Send your supervisor an email letting them know they did not explain the project well.
Doing additional research and asking questions are effective ways to determine how to proceed with a new project.
Question 2
You’re working on a data analysis project with a coworker, and the two of you disagree on what the data is telling you. Things get tense. The best course of action is to go to your supervisor and politely explain that your coworker is looking at the data incorrectly. Then, ask to work with a different coworker on future projects.
- True
- False
Discussion is the key to conflict resolution. If you find yourself in the middle of a conflict, start a conversation so you can each explain your concerns and figure out the best path forward.
Question 3
A director emails you asking for a report by the end of the week. This type of report takes at least 10 days to complete correctly. What is the best course of action?
- Complete the report as best you can by the end of the week so you meet the requested deadline.
- Forward the email to another data analyst on your team, and ask them to do the report instead. It’ll still be late, but at least it won’t reflect poorly on you.
- Email the director and say that you would be happy to do that, but you believe it will take 10 days to get the information you need. Then, ask if you can discuss the possibility of a different timeline.
- Call the director, and let them know there’s no way anyone could possibly meet that deadline.
The best course of action is to email the director to politely explain the timeline required to complete the report properly.
Weekly challenge 4
Question 1
A data analytics team is working on a project to measure the success of a company’s new financial strategy. The vice president of finance is most likely to be the _.
- project manager
- analyst
- secondary stakeholder
- primary stakeholder
The vice president of finance is most likely to be the primary stakeholder.
Question 2
A data analyst is researching the buying behavior of people who shop at a company’s retail store and those who might shop there in the future. During the analysis, it will be important to stay in communication with the team that most often interacts with these shoppers. What is the name of this team?
- Project management team
- Executive team
- Data science team
- Customer-facing team
The customer-facing team includes anyone in an organization who interacts with customers or potential customers, such as the shoppers at a company’s retail store.
Question 3
To communicate clearly with stakeholders and team members, there are four key questions data analysts ask themselves. One of them is: What does my audience need to know? Identify the remaining three questions. Select all that apply.
- How can I communicate effectively to my audience?
- What does my audience already know?
- Who is my audience?
- Why are stakeholders and team members important?
The four key questions data analysts ask themselves when communicating with stakeholders are: Who is my audience? What do they already know? What do they need to know? And how can I communicate effectively with them?
Question 4
A data analyst feels overworked. They often stay late to finish work, and have started missing deadlines. Their supervisor emails them another project to complete, and this causes the analyst even more stress. How should they handle this situation?
- Respond immediately, letting the supervisor know the expectations at this company are unreasonable.
- Accept the new project right away and hope to not miss another deadline.
- Walk into the supervisor’s office and tell them to give the project to someone else.
- Wait a few minutes to think it over, then respond with a meeting request to discuss this project and the general workload.
They should wait a few minutes to think it over, then respond with a meeting request to discuss this project and the general workload. When people are feeling angry or emotional, it’s best to wait until things calm down. Then, give everyone the opportunity to share their perspectives.
Question 5
Data analysts pay attention to sample size in order to achieve what goals? Select all that apply.
- To make sure a few unusual responses don’t skew results
- To make sure the data represents a diverse set of perspectives
- To avoid a small sample size leading to inaccurate judgements
- To fully understand the scope of the analytics project
Data analysts pay attention to sample size in order to represent a diverse set of perspectives and avoid skewed results or inaccurate judgements.
Question 6
A data analyst has been invited to a meeting. They review the agenda and notice that their data analysis project is one of the topics that will be discussed. They plan to arrive on time and have a pen and paper to take notes. But they do not spend time considering project updates they could share or questions they may be asked. This is okay because they’re not the one running the meeting.
- True
- False
Even if the data analyst isn’t running the meeting, if their project is on the agenda, it’s a good idea to prepare to share updates and answer questions. This helps keep everyone informed and ensures effective communication.
Question 7
Which of the following steps are key to leading a professional online meeting? Select all that apply.
- Maintaining control of the meeting by keeping everyone else on mute.
- Sitting in a quiet area that’s free of distractions
- Keeping an eye on your inbox during the meeting in case of an important email
- Making sure your technology is working properly before starting the meeting
When leading an online meeting, acting professionally involves encouraging others to contribute, testing technology beforehand, and eliminating distractions.
Question 8
Conflict is a natural part of working on a team. What are some ways to help shift a situation from problematic to productive? Select all that apply.
- Identify the person who caused the issue so they can take responsibility.
- Ask for a conversation to help you better understand the big picture.
- Take a moment to check your emotions before engaging in an argument.
- Reframe the question by asking, “How can I help?”
To help shift a situation from problematic to productive, reframe the question, keep your emotions in check, and establish open lines of communication.
Course challenge
Scenario 1, questions 1-5
Question 1
You’ve just started a job as a data analyst at a small software company that provides data analytics and business intelligence solutions. Your supervisor asks you to kick off a project with a new client, Athena’s Story, a feminist bookstore. They have four existing locations, and the fifth shop has just opened in your community.
Athena’s Story wants to produce a campaign to generate excitement for an upcoming celebration and introduce the bookstore to the community. They share some data with your team to help make the event as successful as possible.
Your task is to review the assignment and the available data, then present your approach to your supervisor.
Then, review the email, and review the Customer Survey and Historical Sales datasets:
- You may click the link to create a copy of the dataset: Customer Survey
- You may click the link to create a copy of the dataset Historical Sales
After reading the email, you notice that the acronym WHM appears in multiple places. You look it up online, and the most common result is web host manager. That doesn’t seem right to you, as it doesn’t fit the context of a feminist bookstore. How do you proceed?
- Call the client to ask what WHM means and inform them that using acronyms is not a professional business practice.
- Proceed with the project assuming WHM must mean web host manager.
- Schedule a meeting with your supervisor, the client, and another analyst on your team to figure out the meaning.
- Send your supervisor a polite, concise email, asking them to confirm the meaning of WHM.
You should send your supervisor a polite, concise email, asking them to confirm the meaning of WHM.
Question 2
Scenario 1 continued
Now that you know WHM stands for Women’s History Month, you continue reviewing the datasets. You notice the Customer Survey dataset contains both qualitative and quantitative data.
The qualitative data includes information from which columns? Select all that apply.
- Column B (Survey Q2: If answered “Yes” to Q1, how do you plan to celebrate?)
- Column F (Survey Q6: What types of books would you like to see more of at Athena’s Story?)
- Column E (Survey Q5: What do you like most about Athena’s Story?)
- Column D (Survey Q4: If answered “Yes” to Q3, how many books do you typically purchase during March?)
The qualitative data includes information from columns B, E, and F.
Question 3
Next, you review the customer feedback in column F of the Customer Survey (link to download CSV instead below).
CustomerSurvey – CustomerSurvey.csv
The attribute of column F is, “Survey Q6: What types of books would you like to see more of at Athena’s Story?” In order to verify that children’s literature and feminist zines are among the most popular genres, you create a visualization. This will help you clearly identify which genres are most likely to sell well during the Women’s History Month campaign.
Your visualization looks like this:

Fill in the blank: The visualization you create demonstrates the percentages of each book genre that make up the total number of survey responses. It’s called a _ chart.
- pie
- area
- doughnut
- bubble
The visualization is called a pie chart.
Question 4
Now that you’ve confirmed that children’s literature and feminist zines are among the most requested book genres, you review the Historical Sales.
You’re pleased to see that columns D and E have something in common: They both contain data that’s specific to children’s literature and feminist zines. This will provide you with the information you need to make data-inspired decisions. In addition, the children’s literature and feminist zines metrics will help you organize and analyze the data about each genre in order to determine if they’re likely to be profitable.
Next, you use the SUM function to calculate the total sales over 52 weeks for feminist zines. What is the correct syntax? Type your answer below.
=SUM(E2:E53)The correct syntax is =SUM(E2:E53). The SUM function adds the values of a range of cells. E2:E53 is the specified range.
Question 5
After familiarizing yourself with the project and available data, you present your approach to your supervisor. You provide a scope of work, which includes important details, a schedule, and information on how you plan to prepare and validate the data. You also share some of your initial results and the pie chart you created.
In addition, you identify the problem type, or domain, for the data analysis project. You decide that the historical sales data can be used to provide insights into the types of books that will sell best during Women’s History Month this coming year. This will also enable you to determine if Athena’s Story should begin selling more children’s literature and feminist zines.
Using historical data to make informed decisions about how things may be in the future is an example of discovering connections.
- True
- False
Using historical data to make informed decisions about how things may be in the future is an example of making predictions.
Scenario 2, questions 6-10
Question 6
You’ve completed this program and are now interviewing for your first junior data analyst position. You’re hoping to be hired by an event planning company, Patel Events Plus.
So far, you’ve successfully completed the first round of interviews with the human resources manager and director of data and strategy. Now, the vice president of data and strategy wants to learn more about your approach to managing projects and clients.
You arrive Thursday at 1:45 PM for your 2 PM interview. Soon, you’re taken into the office of Mila Aronowicz, vice president of data and strategy. After welcoming you, she begins the behavioral interview.
First, she hands you a copy of Patel Events Plus’s organizational chart.
As you’ve learned in this course, stakeholders are people who invest time, interest, and resources into the projects you’ll be working on as a data analyst. Let’s say you’re working on a project involving data and strategy. Based on what you find in the organizational chart, if you need information from the secondary stakeholders, who can you ask? Select all that apply.
- Project manager, analytics
- Vice president, data and strategy
- Chief executive officer
- Data analytics coordinator
If you need information from the secondary stakeholders, you can ask the project manager and the data analytics coordinator.
Question 7
Next, the vice president wants to understand your knowledge about asking effective questions. Consider and respond to the following question. Select all that apply.
Let’s say we just completed a big event for a client and wanted to find out if they were satisfied with their experience. Provide some examples of measurable questions that you could include in the customer feedback survey.
- Why did you enjoy the event planned by Patel Events Plus?
- Would you recommend Patel Events Plus to a colleague or friend? Yes or no?
- On a scale from 1 to 5, please rate your satisfaction with the event we planned for you.
- How would you describe your event experience?
In the SMART methodology, measurable questions can be quantified and assessed. This might include a 1-to-5 scale or questions with yes-or-no responses.
Question 8
Now, the vice president presents a situation having to do with resolving challenges and meeting stakeholder expectations. Consider and respond to the following question.
You’re working with a dataset that the data analytics coordinator should have cleaned, but it turns out that it wasn’t. Your supervisor thought the dataset was ready for use, but you discover nulls, redundant data, and other issues. The project is due in less than two weeks. How would you handle that situation?
- Contact the associate data analyst and insist they clean the dataset immediately so you don’t miss your project deadline.
- Call a formal meeting with the data analytics team to solve the problem. Do not invite the associate data analyst, as they clearly don’t have time to help.
- Email your supervisor to let them know the associate data analyst did not complete their assigned task.
- Communicate with the associate data analyst about the issue and offer to work together to clean the data so the project doesn’t fall behind.
This situation presents an opportunity to communicate, collaborate, and foster positive working relationships.
Question 9
Your next interview question deals with sharing information with stakeholders. Consider and respond to the following question.
Let’s say you want to share information about an upcoming event with stakeholders. It’s important that they’re able to access and interact with the data in real time. Would you create a report or a dashboard?
- Dashboard
- Report
Dashboards offer live monitoring of incoming data and enable stakeholders to interact with the data.
Question 10
Your final behavioral interview question involves using metrics to answer business questions. Your interviewer hands you a copy of PatelEventsData.
Then, she asks:
Recently, Patel Events Plus purchased a new venue for our events. If we asked you to calculate the return on investment of this purchase, which metrics would you use?
- Purchase date
- 2019 events held at new venue (column D)
- Net profit in 2019 (column F)
- Purchase price (column C)
Return on investment is made up of two metrics: the net profit over a period of time and the cost of the investment. By comparing these two metrics, you can determine the profitability of the investment.
Related content
Google Data Analytics Professional Certificate Course 1: Foundations – Cliffs Notes
Google Data Analytics Professional Certificate Course 3: Prepare Data – quiz answers
Google Data Analytics Professional Certificate Course 4: Process Data – quiz answers
Google Data Analytics Professional Certificate Course 5: Analyze Data – quiz answers
Google Data Analytics Professional Certificate Course 6: Share Data – quiz answers
Google Data Analytics Professional Certificate Course 7: Data Analysis with R – quiz answers
Google Data Analytics Professional Certificate Course 8: Capstone – quiz answers
IT career paths – everything you need to know
Back to DTI Courses
Other content
1st Annual University of Ottawa Supervisor Bullying ESG Business Risk Assessment Briefing
Disgraced uOttawa President Jacques Frémont ignores bullying problem
How to end supervisor bullying at uOttawa
PhD in DTI uOttawa program review
Rocci Luppicini – Supervisor bullying at uOttawa case updates
The case for policy reform: Tyranny
The trouble with uOttawa Prof. A. Vellino
The ugly truth about uOttawa Prof. Liam Peyton
uOttawa engineering supervisor bullying scandal
uOttawa President Jacques Frémont ignores university bullying problem
uOttawa Prof. Liam Peyton denies academic support to postdoc
Updated uOttawa policies and regulations: A power grab
What you must know about uOttawa Prof. Rocci Luppicini
Why a PhD from uOttawa may not be worth the paper it’s printed on
Why uOttawa Prof. Andre Vellino refused academic support to postdoc