Coursera Google Data Analytics Professional Certificate Course 1 – Foundations: Data, Data, Everywhere Cliffs Notes covered here:
- A summary of Coursera Google Data Analytics Professional Certificate Course 1 – Foundations: Data, Data, Everywhere, and
- The quiz answers to Foundations: Data, Data, Everywhere – Coursera Google Data Analytics Professional Certificate Course 1.
By completing the five-week Coursera Google Data Analytics Professional Certificate course Foundations: Data, Data, Everywhere you will:
- Gain an understanding of the practices and processes used by a junior or associate data analyst in their day-to-day job.
- Learn about key analytical skills (data cleaning, data analysis, data visualization) and tools (spreadsheets, SQL, R programming, Tableau) that you can add to your professional toolbox.
- Discover a wide variety of terms and concepts relevant to the role of a junior data analyst, such as the data life cycle and the data analysis process.
- Evaluate the role of analytics in the data ecosystem.
- Conduct an analytical thinking self-assessment.
- Explore job opportunities available to you upon program completion, and learn about best practices in the job search.
Modules covered in this course
- Week 1: Introducing data analytics
- Week 2: Thinking analytically
- Week 3: Exploring the wonderful world of data
- Week 4: Setting up a data toolbox
- Week 5: Discovering data career possibilities
You may also be interested in Google Data Analytics Professional Certificate quiz answers.
Google Data Analytics Professional Certificate quiz answers
Google Data Analytics Professional Certificate Course 2: Ask Questions – quiz answers
Google Data Analytics Professional Certificate Course 3: Prepare Data – quiz answers
Google Data Analytics Professional Certificate Course 4: Process Data – quiz answers
Google Data Analytics Professional Certificate Course 5: Analyze Data – quiz answers
Google Data Analytics Professional Certificate Course 6: Share Data – quiz answers
Google Data Analytics Professional Certificate Course 7: Data Analysis with R – quiz answers
Google Data Analytics Professional Certificate Course 8: Capstone – quiz answers
Week 1: Introducing data analytics
1.1. The data analysis life cycle
The data analysis life cycle is the process of going from data to decision.
<Data goes through several phases as it gets created, consumed, tested, processed, and reused. With a life cycle model, all key team members can drive success by planning work both up front and at the end of the data analysis process.>
Google’s data analysis life cycle model is comprised of six steps applicable to any data analysis.
Ask: Business Challenge/Objective/Question
Prepare: Data generation, collection, storage, and data management
Process: Data cleaning/data integrity
Analyze: Data exploration, visualization, and analysis
Share: Communicating and interpreting results
Act: Putting your insights to work to solve the problem
Other variations of the data analysis life cycle include: EMC’s data analysis life cycle, SAS’ iterative life cycle, Project-based data analytics life cycle, Big data analytics life cycle, and Data life cycle based on research.
1.2. The 6 steps of data analysis
Case Study: New data perspectives
<A real-life example of how one group of data analysts used the six steps of the data analysis process to improve their workplace and its business processes. Their story involves something called people analytics — also known as human resources analytics or workforce analytics.
<An organization was experiencing a high turnover rate among new hires. Many employees left the company before the end of their first year on the job. The analysts used the data analysis process to answer the following question: how can the organization improve the retention rate for new employees?>
The data analysis process phases are ask, prepare, process, analyze, share, and act. What do data analysts do during the ask phase? They ask effective questions and collaborate with leaders and managers to define the business challenge and project objectives.
1) Ask: <First up, the analysts in our example needed to define what the project would look like and what would qualify as a successful result. So, to determine these things, they asked effective questions and collaborated with leaders and managers who were interested in the outcome of their people analysis.>
2) Prepare: <The group built a timeline of three months and decided how they wanted to relay their progress to interested parties. Also during this step, the analysts identified what data they needed to achieve the successful result they identified in the previous step – in this case, the analysts chose to gather the data from a survey of new employees.
<They identified specific questions to ask about employee satisfaction with different business processes, such as hiring, onboarding, and compensation. Rules were established for who would have access to the data collected, what specific information would be gathered, and how best to present the data visually. The analysts brainstormed possible project- and data-related issues and how to avoid them.>
3) Process: <The group sent the survey out. Great analysts know how to respect both their data and the people who provide it. Since employees provided the data, it was important to make sure all employees gave their consent to participate. The data analysts also made sure employees understood how their data would be collected, stored, managed, and protected.
<In order to maintain confidentiality and protect and store the data effectively, access was restricted to a limited number of analysts. Collecting and using data ethically is one of the responsibilities of a data analyst. Then the data was cleaned up to make sure it was complete, correct, and relevant, and uploaded to an internal data warehouse for an additional layer of security.>
4) Analyze: <From the completed surveys, the data analysts would discover that a new employee’s experience with the hiring process was a key indicator of overall job satisfaction. The analysts found that employees who experienced an efficient and transparent hiring process were most likely to remain with the company. Employees who experienced a long and complicated hiring process were most likely to leave the company.
<The group knew it was important to document exactly what they found in the analysis, no matter what the results. To do otherwise would decrease trust in the survey process and reduce their ability to collect truthful data from employees in the future.>
5) Share: <Just as they made sure the data was carefully protected, the analysts were also careful sharing the report. For example, in order for a manager to receive the survey report, a minimum number of their team members had to have participated in the survey.
<The group presented the results to leaders first to make sure they had the full picture, then asked them to deliver the results to their teams. This gave leaders an opportunity to communicate the results with the right context and have productive team conversations about next steps.>
6) Act: <The last stage of the process for the team of analysts was to work with leaders within their company and decide how best to implement changes and take actions based on the findings. The analysts recommended standardizing the hiring process for all new hires based on the most efficient and transparent hiring practices.
<A year later, the same survey was distributed to employees. Analysts anticipated that a comparison between the two sets of results would indicate that the action plan worked. Turns out, the changes improved the retention rate for new employees and the actions taken by leaders were successful!>
Answers to week 1 quiz questions
Question 1
Data analysis is the various elements that interact with one another in order to provide, manage, store, organize, analyze, and share data.
* True
* False*
Data analysis is the collection, transformation, and organization of data in order to draw conclusions, make predictions, and drive informed decision-making.
Question 2
In data analytics, what term describes a collection of elements that interact with one another?
* A data ecosystem*
* A database
* The cloud environment
* A modelling system
Data ecosystems are made up of elements that interact to produce, manage, store, organize, analyze, and share data.
Question 3
Fill in the blank: The primary goal of a data _____ is to find answers to existing questions by creating insights from data sources.
* engineer
* analyst*
* scientist
* designer
The primary goal of a data analyst is to find answers to existing questions by creating insights from data sources.
Question 4
Select the best description of gut instinct.
* An intuitive understanding of something with little or no explanation*
* Choosing facts that complement your personal experiences
* Manipulating data to match your intuition
* Using your innate ability to analyze results
Gut instinct is an intuitive understanding of something with little or no explanation.
Question 5
Billings Upholstery has defined a problem it needs to solve: Find a more environmentally friendly way to produce its furniture. A data analyst gathers relevant data, analyzes it, and uses it to draw conclusions. The analyst then shares their analysis with subject-matter experts from the manufacturing team, who validate the findings. Finally, a plan is put into action. This scenario describes what process?
* Data-driven decision-making*
* Identification of trends
* Data science
* Customer service
This company has put data at the heart of its business strategy in order to achieve data-driven decision-making.
Question 6
What do subject-matter experts do to support data-driven decision-making? Select all that apply.
* Validate the choices made as a result of the data insights*
* Collect, transform, and organize data
* Offer insights into the business problem*
* Review the results of data analysis and identify any inconsistencies*
Subject-matter experts can offer insights into the business problem, identify inconsistencies in the analysis, and validate the choices being made.
Question 7
Sharing the results of your analysis with colleagues who are very familiar with the business problem supports what practice?
* Data analytics
* Data-driven decision-making*
* Data management
* Data science
Sharing the results of your analysis with people who are familiar with the business problem is an example of data-driven decision-making. Data-driven decision-making is using facts to guide business strategy.
Question 8
You read an interesting article in a magazine and want to share it in the discussion forum. What should you do when posting? Select all that apply.
* Make sure the article is relevant to data analytics*
* Check your post for typos or grammatical errors*
* Take credit for creating the article.
* Include your email address for people to send questions or comments.
Posts should be relevant to data analytics and checked for typos and grammatical errors.
Week 2: Thinking analytically
<Analytical skills are qualities and characteristics associated with solving problems using facts.>
2.1. “Key data analyst skills” or “5 skills data analysts need” or “5 essential skills for data analysts” or “5 crucial skills analysts need”
1) Curiosity, 2) understanding context (e.g., grouping similar objects together), 3) having a technical mindset (esp. breaking down problems/tasks into smaller units), 4) data design (esp. how information is organized), and 5) data strategy (people, process, tools used in data analysis).
2.2. Analytical thinking
What practice involves identifying, defining, and solving a problem by using data in an organized, step-by-step manner? Analytical thinking.
<As data analysts, how do we think analytically? Well, to answer that question, we will now talk about a second set of five.>
The five key aspects to analytical thinking: 1) Visualization, 2) strategy, 3) problem-orientation, 4) correlation, and 5) big-picture and detail-oriented thinking.
Answers to week 2 quiz questions
Question 1
Seeking out new challenges and experiences in order to learn is an example of which analytical skill?
* Understanding context
* Having a technical mindset
* Data strategy
* Curiosity*
Curious people seek out new challenges, which leads to knowledge.
Question 2
Understanding context is an analytical skill best described by which of the following? Select all that apply.
* Working with facts in an orderly manner
* Identifying the motivation behind the collection of a dataset*
* Adding descriptive headers to columns of data in a spreadsheet *
* Gathering additional information about data to understand the broader picture*
Context is the condition in which something exists, such as a structure. Gathering extra information about data to understand the broader picture provides context.
Question 3
A data analyst works for an appliance manufacturer. Last year, the company’s profits were down. Lower profits can be a result of fewer people buying appliances, higher costs to make appliances, or a combination of both. The analyst recognizes that those are big issues to solve, so they break down the problems into smaller pieces to analyze them in an orderly way. Which analytical skill are they using?
* Understanding context
* Data strategy
* A technical mindset*
* Curiosity
They are using a technical mindset, which involves the ability to break things down into smaller steps or pieces and work with them in an orderly and logical way.
Question 4
Data design is how you organize information; data strategy is the management of the people, processes, and tools used in data analysis.
* True*
* False
Data design is how you organize information; data strategy is the management of the people, processes, and tools used in data analysis.
Question 5
Fill in the blank: Being able to identify a relationship between two or more pieces of data describes _____.
* correlation*
* detail-oriented thinking
* problem-orientation
* visualization
Being able to identify a relationship between two or more pieces of data describes correlation.
Question 6
What method involves asking numerous questions in order to get to the root cause of a problem?
* Inquiry
* Strategizing
* Curiosity
* The five whys*
The five whys involves asking numerous questions in order to get to the root cause of a problem?
Question 7
What method involves examining and evaluating how a process works currently in order to get it where you want it to be in the future?
* The five whys
* Data visualization
* Gap analysis *
* Strategy
Gap analysis is a method for examining and evaluating how a process works currently in order to get where you want to be in the future.
Question 8
Data-driven decision-making involves the five analytical skills: curiosity, understanding context, having a technical mindset, data design, and data strategy. Each plays a role in data-driven decision-making.
* True*
* False
Data-driven decision-making involves curiosity, understanding context, having a technical mindset, data design, and data strategy.
Week 3: Exploring the wonderful world of data
The data life cycle six phases: Plan, capture, manage, analyze, archive, and destroy.
1) Plan: <During planning, a business decides what kind of data it needs, how it will be managed throughout its life cycle, who will be responsible for it, and the optimal outcomes.>
2) Capture: <This is where data is collected from a variety of different sources and brought into the organization … For example, if you were doing data analysis on weather patterns, you’d probably get data from a publicly available dataset like the National Climatic Data Center.>
3) Manage: <Here we’re talking about how we care for our data, how and where it’s stored, the tools used to keep it safe and secure, and the actions taken to make sure that it’s maintained properly. This phase is very important to data cleansing.>
4) Analyze: <This is where data analysts really shine. In this phase, the data is used to solve problems, make great decisions, and support business goals.>
5) Archive: <storing data in a place where it’s still available, but may not be used again.>
6) Destroy: <This is important for protecting a company’s private information, as well as private data about its customers.>
Answers to week 3 quiz questions
Question 1
The manage stage of the data life cycle is when a business decides what kind of data it needs, how the data will be handled, and who will be responsible for it.
* True
* False*
During planning, a business decides what kind of data it needs, how it will be managed throughout its life cycle, who will be responsible for it, and the optimal outcomes.
Question 2
A data analyst has finished an analysis project that involved private company data. They erase the digital files in order to keep the information secure. This describes which stage of the data life cycle?
* Manage
* Destroy*
* Plan
* Archive
This describes the destroy phase, during which data analysts use secure data-erasure software and shred paper files to protect private information.
Question 3
In the analyze phase of the data life cycle, what might a data analyst do? Select all that apply.
* Use a formula to perform calculations*
* Use spreadsheets to aggregate data*
* Create a report from the data*
* Choose the format of spreadsheet headings
In the analyze phase of the data life cycle, a data analyst might use formulas to perform calculations, create a report from the data, or use spreadsheets to aggregate data.
Question 4
Describe how the data life cycle differs from data analysis.
* The data life cycle deals with transforming and verifying data; data analysis is using the insights gained from the data.
* The data life cycle deals with the stages that data goes through during its useful life; data analysis is the process of analyzing data.*
* The data life cycle deals with making informed decisions; data analysis is using tools to transform data.
* The data life cycle deals with identifying the best data to solve a problem; data analysis is about asking effective questions.
The data life cycle involves stages for identifying needs and managing data. Data analysis involves process steps to make meaning from data.
Question 5
A company takes insights provided by its data analytics team, validates them, and finalizes a strategy. They then implement a plan to solve the original business problem. This describes which step of the data analysis process?
* Analyze
* Process
* Share
* Act*
The act phase is when insights are put into action.
Question 6
Fill in the blank: Spreadsheets are _____ that can be used to store, organize, and sort data.
* digital worksheets*
* formulas and functions
* interactive dashboards
* visual representations
Spreadsheets are digital worksheets that can be used to store, organize, and sort data.
Question 7
Fill in the blank: A formula is a set of instructions used to perform a specified calculation; whereas a function is _____.
* a question written by the user
* a predefined operation*
* a computer programming language
* a particular value
A formula is a set of instructions used to perform a specified calculation; a function is a preset command that automatically performs a specified process.
Question 8
Fill in the blank: A query is used to _____ information from a database. Select all that apply.
* update*
* request*
* retrieve*
* analyze
A query enables data analysts to request, retrieve, and update information from a database.
Question 9
Structured query language (SQL) enables data analysts to communicate with a database.
* True*
* False
SQL allows a data analyst to communicate with a database in order to retrieve and manipulate data.
Question 10
The graphical representation of information helps stakeholders understand data insights. Formulas and functions make this possible.
* True
* False*
The graphical representation of information is made possible by data visualization tools. These tools help stakeholders understand data insights.
Week 4: Setting up a data toolbox
Topics covered in Week 4 module include: Mastering spreadsheet basics (practice exercise); Learning about Structured Query Language (SQL); Visualizing the data; Introducing Qwiklabs.
<In this reading, we will explore the steps involved in the data visualization process and a few of the most common data visualization tools available.>
4.1. Three steps to plan a data visualization
Visualizing the data: Planning data visualization
<Imagine you’re a data analyst for a clothing distributor. The company helps small clothing stores manage their inventory, and sales are booming. One day, you learn that your company is getting ready to make a major update to its website. To guide decisions for the website update, you’re asked to analyze data from the existing website and sales records. Let’s go through the steps you might follow.>
Step 1: Explore the data for patterns
<First, you ask your manager or the data owner for access to the current sales records and website analytics reports. This includes information about how customers behave on the company’s existing website … While reviewing the data you notice a pattern among those who visit the company’s website most frequently: geography and larger amounts spent on purchases. With further analysis, this information might explain why sales are so strong right now in the northeast…>
Step 2: Plan your visuals
<now, you have a lot of data spread across several different tables, which isn’t an ideal way to share your results with management and the marketing team. You will want to create a data visualization that explains your findings quickly and effectively to your target audience. Since you know your audience is sales oriented, you already know that the data visualization you use should:
- Show sales numbers over time
- Connect sales to location
- Show the relationship between sales and website use
- Show which customers fuel growth
Step 3: Create your visuals
<creating the right visualization for a presentation or to share with stakeholders is a process. It involves trying different visualization formats and making adjustments until you get what you are looking for.>
Line charts can track sales over time
Maps can connect sales to locations
Donut charts can show customer segments
Bar charts can compare total visitors and visitors that make a purchase
<Your choice of visualization will be driven by a variety of drivers including the size of your data, the process you used for analyzing your data (spreadsheet, or databases/queries, or programming languages).>
4.2. Data visualization tools
Spreadsheets (Microsoft Excel or Google Sheets)
<Spreadsheets are great for creating simple visualizations like bar graphs and pie charts, and even provide some advanced visualizations like maps, and waterfall and funnel diagrams.>
Visualization software (Tableau)
<Tableau is a popular data visualization tool that lets you pull data from nearly any system and turn it into compelling visuals or actionable insights.
Start exploring Tableau from the How-to Video resources on Tableau Public, a one-stop-shop for how-to videos, examples, and datasets for you to practice with. To explore what other data analysts are sharing on Tableau, visit the Viz of the Day page.
https://public.tableau.com/en-us/s/resources
Programming language (R with RStudio)
<A lot of data analysts work with a programming language called R. Most people who work with R end up also using RStudio, an integrated developer environment (IDE), for their data visualization needs. As with Tableau, you can create dashboard-style data visualizations using RStudio.>
Training resources at RStudio.com: the RStudio Cheatsheets and the RStudio Visualize Data Primer are great places to start.
Answers to week 4 quiz questions
Question 1
The column attributes for rank, name, population, and county are located in which row of the following spreadsheet?
| A | A | B | C | D |
|---|---|---|---|---|
| 1 | Rank | Name | Population | County |
| 2 | 1 | Charlotte | 885,708 | Mecklenburg |
| 3 | 2 | Raleigh | 474,069 | Wake (seat), Durham |
| 4 | 3 | Greensboro | 296,710 | Guilford |
| 5 | 4 | Durham | 278,993 | Durham (seat), Wake, Orange |
| 6 | 5 | Winston-Salem | 247,945 | Forsyth |
| 7 | 6 | Fayetteville | 211,657 | Cumberland |
| 8 | 7 | Cary | 170,282 | Wake, Chatham |
| 9 | 8 | Wilmington | 123,784 | New Hanover |
| 10 | 9 | High Point | 112,791 | Guilford, Randolph, Davidson, Forsyth |
| 11 | 10 | Concord | 96,341 | Cabarrus |
* 11
* 1*
* 2
* 10
The column labels in row 1 are attributes that refer to the data in the column. An attribute is a characteristic or quality of data used to label a column in a table.
Question 2
Fill in the blank: In row 8 of the following spreadsheet, you can find the _____ of Cary.
| A | B | C | D | |
|---|---|---|---|---|
| 1 | Rank | Name | Population | County |
| 2 | 1 | Charlotte | 885,708 | Mecklenburg |
| 3 | 2 | Raleigh | 474,069 | Wake (seat), Durham |
| 4 | 3 | Greensboro | 296,710 | Guilford |
| 5 | 4 | Durham | 278,993 | Durham (seat), Wake, Orange |
| 6 | 5 | Winston-Salem | 247,945 | Forsyth |
| 7 | 6 | Fayetteville | 211,657 | Cumberland |
| 8 | 7 | Cary | 170,282 | Wake, Chatham |
| 9 | 8 | Wilmington | 123,784 | New Hanover |
| 10 | 9 | High Point | 112,791 | Guilford, Randolph, Davidson, Forsyth |
| 11 | 10 | Concord | 96,341 | Cabarrus |
* criteria
* attribute
* format
* observation*
The observation of Cary is in row 8. An observation is all of the attributes for something contained in a row of a data table.
Question 3
If a data analyst wants to list the cities in this spreadsheet alphabetically, instead of numerically, what feature can they use in column B?
| A | B | C | D | |
|---|---|---|---|---|
| 1 | Rank | Name | Population | County |
| 2 | 1 | Charlotte | 885,708 | Mecklenburg |
| 3 | 2 | Raleigh | 474,069 | Wake (seat), Durham |
| 4 | 3 | Greensboro | 296,710 | Guilford |
| 5 | 4 | Durham | 278,993 | Durham (seat), Wake, Orange |
| 6 | 5 | Winston-Salem | 247,945 | Forsyth |
| 7 | 6 | Fayetteville | 211,657 | Cumberland |
| 8 | 7 | Cary | 170,282 | Wake, Chatham |
| 9 | 8 | Wilmington | 123,784 | New Hanover |
| 10 | 9 | High Point | 112,791 | Guilford, Randolph, Davidson, Forsyth |
| 11 | 10 | Concord | 96,341 | Cabarrus |
* Organize range
*Sort range*
*Name range
*Randomize range
Sort range would be used to alphabetize the city names in column B. Sorting a range of data from A to Z helps data analysts organize and find data more quickly.
Question 4
A data analyst types =POPULATION(C2:C11) to find the average population of the cities in this spreadsheet. However, they realize that have used the wrong formula. What syntax will correct this function? Type your answer below.
| A | B | C | D | |
|---|---|---|---|---|
| 1 | Rank | Name | Population | County |
| 2 | 1 | Charlotte | 885,708 | Mecklenburg |
| 3 | 2 | Raleigh | 474,069 | Wake (seat), Durham |
| 4 | 3 | Greensboro | 296,710 | Guilford |
| 5 | 4 | Durham | 278,993 | Durham (seat), Wake, Orange |
| 6 | 5 | Winston-Salem | 247,945 | Forsyth |
| 7 | 6 | Fayetteville | 211,657 | Cumberland |
| 8 | 7 | Cary | 170,282 | Wake, Chatham |
| 9 | 8 | Wilmington | 123,784 | New Hanover |
| 10 | 9 | High Point | 112,791 | Guilford, Randolph, Davidson, Forsyth |
| 11 | 10 | Concord | 96,341 | Cabarrus |
=AVERAGE(C2:C11)The correct AVERAGE function syntax is =AVERAGE(C2:C11). AVERAGE returns an average of values from a selected range. C2:C11 is the specified range.
Question 5
In the following query, what is FROM telling the database to do?
SELECT * FROM Orders* From which field data should be stored
* From which table to select data*
* From which filter data should be selected
* From which field data should be updated
In a query, data analysts use FROM to indicate the table from which the data will be retrieved.
Question 6
You are writing a query that asks a database to retrieve data about the customer with identification number 5656. The column name for customer identification numbers is customer_id. What is the correct WHERE clause syntax? Type your answer below.
WHERE customer_id = 5656The correct WHERE clause syntax is WHERE customer_id = 5656. WHERE is used to extract only those records that meet a specified criteria. Customer_id = 5656 tells the database to return only information about the customer whose ID is 5656.
Question 7
A data analyst creates the following visualization to clearly demonstrate how much more populous Charlotte is than the next-largest North Carolina city, Raleigh. What type of chart is it?

* A scatter chart
* A pie chart
* A line chart
*A column, or bar, chart*
The chart is a column chart. A column chart is effective at demonstrating the differences between several items in a specific range of values.
Question 8
A data analyst wants to demonstrate how the population in Charlotte has increased over time. They create the chart below. What is this type of chart called?

* Column chart
* Area chart
* Line chart*
* Bar chart
This is a line chart. Line charts are effective for demonstrating trends and patterns, such as how population changes over time.
Week 5: Discovering data career possibilities
Topics covered in Week 5 module include: Data analyst career possibilities, Data analyst job opportunities, Making decisions with data, Defining fairness in data, and Exploring your next job.
Making decisions with data: The power of data in business
<An issue is a topic or subject to investigate. A question is designed to discover information and a problem is an obstacle or complication that needs to be worked out.>
<A business task is the question or problem data analysis answers for business. This is where you focus a lot of your efforts in the work you’ll do for future employers.>
<Data-driven decision-making is when facts that have been discovered through data analysis are used to guide business strategy. The simplest way to think about decision-making is that it’s a choice between consequences, good, bad, or a combination of both.>
Defining fairness in data
<Fairness means ensuring that your analysis doesn’t create or reinforce bias. In other words, as a data analyst, you want to help create systems that are fair and inclusive to everyone.>
Exploring your next job: Data analyst roles and job descriptions
<Everything from websites to social media feeds are filled with fascinating data that, when analyzed and used correctly, can help inform business decisions. A company’s ability to thrive now often depends on how well it can leverage data, apply analytics, and implement new technologies.>
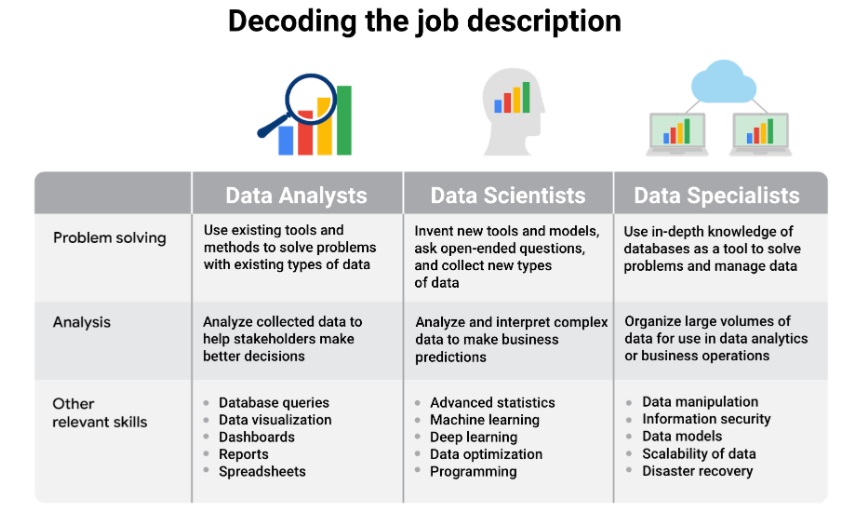
Decoding the job description
<The data analyst role is one of many job titles that contain the word “analyst.” To name a few others that sound similar but may not be the same role:
- Business Analyst—analyzes data to help businesses improve processes, products, or services
- Business Intelligence Analyst—analyzes data for finance or market insights
- Data Analytics Consultant—analyzes the systems and models for using data
- Data Engineer—prepares and integrates data from different sources for analytical use
- Data Scientist—uses expert skills in technology and social science to find trends through data analysis
- Data Specialist—organizes or converts data for use in databases or software systems
- Operations Analyst—analyzes data to assess the performance of business operations and workflows
<As you start to browse job listings online, you might notice that companies’ job descriptions seem to combine these roles or look for candidates who may have overlapping skills. The fact that companies often blur the lines between them means that you should take special care when reading the job descriptions and the skills required.
The table below illustrates some of the overlap and distinctions between them.
Job specializations by industry
<Other industry-specific specialist positions that you might come across in your data analyst job search include:
- Marketing analyst—analyzes market conditions to assess the potential sales of products and services
- HR/payroll analyst—analyzes payroll data for inefficiencies and errors
- Financial analyst—analyzes financial status by collecting, monitoring, and reviewing data
- Risk analyst—analyzes financial documents, economic conditions, and client data to help companies determine the level of risk involved in making a particular business decision
- Healthcare analyst—analyzes medical data to improve the business aspect of hospitals and medical facilities.>
Answers to week 5 quiz questions
Question 1
Scenario 1, Questions 1-5
You’ve just started a new job as a data analyst. You’re working for a midsized pharmacy chain with 38 stores in the American Southwest. Your supervisor shares a new data analysis project with you.She explains that the pharmacy is considering discontinuing a bubble bath product called Splashtastic. Your supervisor wants you to analyze sales data and determine what percentage of each store’s total daily sales come from that product. Then, you’ll present your findings to leadership.You know that it’s important to follow each step of the data analysis process: ask, prepare, process, analyze, share, and act. So, you begin by defining the problem and making sure you fully understand stakeholder expectations.
One of the questions you ask is where to find the dataset you’ll be working with. Your supervisor explains that the company database has all the information you need. Next, you continue to the prepare step. You access the database and write a query to retrieve data about Splashtastic. You notice that there are only 38 rows of data, representing the company’s 38 stores. In addition, your dataset contains five columns: Store Number, Average Daily Customers, Average Daily Splashtastic Sales (Units), Average Daily Splashtastic Sales (Dollars), and Average Total Daily Sales (All Products).
Considering the size of your dataset, what’s the best way to proceed with the process and analyze steps?
* Download the data, then use a spreadsheet to process and analyze it*
* Continue using the company database to process and analyze the data
* Upload the data, then process and analyze it using Tableau
* Use SQL to process and analyze the data.
Spreadsheets work well for processing and analyzing a small dataset, such as the one you’re using.
Question 2
Scenario 1 continued
You’ve downloaded the data from your company database and imported it into a spreadsheet. To use the dataset for this scenario, click the link below and select “Use Template.”
Link to template: Course Challenge – Scenario 1
OR
If you don’t have a Google account, you can download the template directly from the attachment below.
Course Challenge Dataset – Scenario 1 – Scenario 1_ Pharmacy Data – Part 1.csv
Now, it’s time to process the data. As you know, this step involves finding and eliminating errors and inaccuracies that can get in the way of your results. While cleaning the data, you notice that information about Splashtastic is missing in row 16. The best course of action is to delete row 16 from your dataset so the missing data doesn’t get in the way of your results.
* True
* False*
The data processing step involves finding and eliminating errors and inaccuracies that can get in the way of your results.
Question 3
Scenario 1 continued
Once you’ve found the missing information, you analyze your dataset. During analysis, you create a new column F. At the top of the column, you add: Average Percentage of Total Sales – Splashtastic. In data analytics, this column label is called an attribute.
* True*
* False
This column label is an attribute, which is a characteristic or quality of data used to label a column.
Question 4
Scenario 1 continued
Next, you determine the average total daily sales over the past 12 months at all stores, The range that contains these sales is E2:E39. To do this, you use a function. Fill in the blank to complete the function correctly: =_____ (E2:E39).
* AVERAGE*
* SUM
* SALES
* TOTAL
The function begins with an equal sign (=), then the word AVERAGE. The range is all of column E, represented by E:E.
Question 5
Scenario 1 continued
You’ve reached the share phase of the data analysis process. It involves which of the following? Select all that apply.
* Create a data visualization to highlight the Splashtastic sales insights you’ve discovered*
* Prepare a slideshow about Splashtastic’s sales and practice your presentation*
* Stop selling Splashtastic because it doesn’t represent a large percentage of total sales
* Present your findings about Splashtastic to stakeholders*
The share phase involves creating data visualizations, preparing your presentation, and communicating your findings to stakeholders.
Question 6
Scenario 2, questions 6-10
You’ve been working for the nonprofit National Dental Society (NDS) as a junior data analyst for about two months. The mission of the NDS is to help its members advance the oral health of their patients. NDS members include dentists, hygienists, and dental office support staff. The NDS is passionate about patient health. Part of this involves automatically scheduling follow-up appointments after crown replacement, emergency dental surgery, and extraction procedures. NDS believes the follow-up is an important step to ensure patient recovery and minimize infection. Unfortunately, many patients don’t show up for these appointments, so the NDS wants to create a campaign to help its members learn how to encourage their patients to take follow-up appointments seriously. If successful, this will help the NDS achieve its mission of advancing the oral health of all patients.
Your supervisor has just sent you an email saying that you’re doing very well on the team, and he wants to give you some additional responsibility. He describes the issue of many missed follow-up appointments. You are tasked with analyzing data about this problem and presenting your findings using data visualizations. An NDS member with three dental offices in Colorado offers to share its data on missed appointments. So, your supervisor uses a database query to access the dataset from the dental group. The query instructs the database to retrieve all patient information from the member’s three dental offices, located in zip code 81137.
The table is dental_data_table, and the column name is zip_code. How do you complete the following query?
* WHERE_zip_code = 81137
* WHERE = 81137
* WHERE zip_code = 81137*
* zip_code = 81137
The correct syntax is WHERE zip_code = 81137. WHERE indicates where to look for information. The column name is zip_code. And the database is being asked to return only records matching zip code 81137.
Question 7
Scenario 2 continued
The dataset your supervisor retrieved and imported into a spreadsheet includes a list of patients, their demographic information, dental procedure types, and whether they attended their follow-up appointment. To use the dataset for this scenario, click the link below and select “Use Template.”
Link to template: Course Challenge – Scenario 2
OR
If you don’t have a Google account, you can download the template directly from the attachment below.
Course Challenge Dataset – Scenario 2.csv
The patient demographic information includes data such as age and gender. As you’re learning, it’s your responsibility as a data analyst to make sure your analysis is fair. The fact that the dataset includes people who all live in the same zip code might get in the way of fairness.
* True*
* False
It’s your responsibility as a data analyst to make sure your analysis is fair. Although many zip codes do reflect diverse populations, a better choice would be to include data about people who live in multiple zip codes.
Question 8
Scenario 2 continued
As you’re reviewing the dataset, you notice that there are a disproportionate number of senior citizens. So, you investigate further and find out that this zip code represents a rural community in Colorado with about 800 residents. In addition, there’s a large assisted-living facility in the area. Nearly 300 of the residents in the 81137 zip code live in the facility.
You recognize that’s a sizable number, so you want to find out if age has an effect on a patient’s likelihood to attend a follow-up dental appointment. You analyze the data, and your analysis reveals that older people tend to miss follow-ups more than younger people.
So, you do some research online and discover that people over the age 60 are 50% more likely to miss dentist appointments. Sometimes this is because they’re on a fixed income. Also, many senior citizens lack transportation to get to and from appointments.
With this new knowledge, you write an email to your supervisor expressing your concerns about the dataset. He agrees with your concerns, but he’s also impressed with what you’ve learned and thinks your findings could be very important to the project. He asks you to change the business task. Now, the NDS campaign will be about educating dental offices on the challenges faced by senior citizens and finding ways to help them access quality dental care.
Changing the business task involves defining the new question or problem to be solved.
* True*
* False
A business task is the question or problem data analysis answers for a business.
Question 9
Scenario 2 continued
You continue with your analysis. In the end, your findings support what you discovered during your online research: As people get older, they’re less likely to attend follow-up dental visits. But you’re not done yet. You know that data should be combined with human insights in order to lead to true data-driven decision-making. So, your next step is to share this information with people who are familiar with the problem. They’ll help verify the results of your data analysis.
The people who are familiar with a problem and help verify the results of data analysis include customers and competitors.
* True
* False*
The people who are familiar with a problem and help verify the results of data analysis include subject-matter experts.
Question 10
Scenario 2 continued
The subject-matter experts are impressed by your analysis. The team agrees to move to the next step: data visualization. You know it’s important that stakeholders at NDS can quickly and easily understand that older people are less likely to attend important follow-up dental appointments. This will help them create an effective campaign for members.
It’s time to create your presentation to stakeholders. It will include a data visualization that demonstrates the trend of people being less likely to attend follow-up appointments as they get older. Which type of chart will be most effective?
* A pie chart
* A table
* A doughnut chart
* A line chart*
A line chart is effective for tracking trends over time, such as people attending fewer follow-up appointments as they get older.
Weekly challenge
Question 1
An online gardening magazine wants to understand why its subscriber numbers have been increasing. What kind of reports can a data analyst provide to help answer that question? Select all that apply.
* Reports that predict the success of sales leads to secure future subscribers
* Reports that compare past weather patterns to the number of people taking up gardening recently*
* Reports that show how many customers shared positive comments about the gardening magazine on social media in the past year*
* Reports that examine how a recent 50%-off sale affected the number of subscription purchases*
Analyzing historical data such as weather patterns, social media comments, and past sales would provide useful insights into the increase in subscription numbers.
Question 2
Fill in the blank: A doctor’s office has discovered that patients are waiting 20 minutes longer for their appointments than in past years. To help solve this problem, a data analyst could investigate how many nurses are on staff at a given time compared to the number of _____.
* doctors seeing new patients
* doctors on staff at the same time
* patients with appointments*
* negative comments about the wait times on social media
Analyzing staffing and patient numbers would likely provide useful insights about why patients are waiting longer for their appointment times and to help solve this problem.
Question 3
What is the process of using facts to guide business strategy?
* Data programming
* Data visualization
* Data ethics
* Data-driven decision-making*
Data-driven decision-making is using facts to guide business strategy.
Question 4
Fill in the blank: A problem is an obstacle to be solved, an issue is a topic to investigate, and a _____ is designed to discover information.
* solution
* comment
* question*
* complaint
A business task is described as the problem or question a data analyst answers for a business.
Question 5
What is a question or problem that a data analyst answers for a business?
* Mission statement
* Hypothesis
* Complaint
* Business task*
A business task is a question or problem that a data analyst answers for a business.
Question 6
Which of the following examples describe fairness in data analysis? Select all that apply.
* Picking and choosing which data to include from a dataset
* Factoring in social contexts that could create bias in conclusions
* Considering systematic factors that may influence data
* Making sure a sample population represents all groups
Considering systematic factors that may influence your data, factoring in social contexts that could create bias in your conclusions, and making sure your sample population represents all groups are effective ways to ensure that your analysis is fair and doesn’t create or reinforce bias.
Question 7
Fill in the blank: Fairness is achieved when data analysis doesn’t create or _ bias.
* resolve
* reinforce*
* constrain
* highlight
Fairness is achieved when data analysis doesn’t create or reinforce bias.
Question 8
A gym wants to start offering exercise classes. A data analyst plans to survey 10 people to determine which classes would be most popular. To ensure the data collected is fair, what steps should they take? Select all that apply.
* Collect data anonymously*
* Survey only people who don’t currently go to the gym
* Increase the number of participants*
* Ensure participants represent a variety of profiles and backgrounds*
Ensuring participants represent a variety of profiles and backgrounds, collecting data anonymously, and surveying more than just 10 people would all help ensure the data analysis is fair.
Related content
Google Data Analytics Professional Certificate Course 2: Ask Questions – quiz answers
Google Data Analytics Professional Certificate Course 3: Prepare Data – quiz answers
Google Data Analytics Professional Certificate Course 4: Process Data – quiz answers
Google Data Analytics Professional Certificate Course 5: Analyze Data – quiz answers
Google Data Analytics Professional Certificate Course 6: Share Data – quiz answers
Google Data Analytics Professional Certificate Course 7: Data Analysis with R – quiz answers
Google Data Analytics Professional Certificate Course 8: Capstone – quiz answers
Back to DTI Courses
Other content
1st Annual University of Ottawa Supervisor Bullying ESG Business Risk Assessment Briefing
Disgraced uOttawa President Jacques Frémont ignores bullying problem
How to end supervisor bullying at uOttawa
PhD in DTI uOttawa program review
Rocci Luppicini – Supervisor bullying at uOttawa case updates
The case for policy reform: Tyranny
The trouble with uOttawa Prof. A. Vellino
The ugly truth about uOttawa Prof. Liam Peyton
uOttawa engineering supervisor bullying scandal
uOttawa President Jacques Frémont ignores university bullying problem
uOttawa Prof. Liam Peyton denies academic support to postdoc
Updated uOttawa policies and regulations: A power grab
What you must know about uOttawa Prof. Rocci Luppicini
Why a PhD from uOttawa may not be worth the paper it’s printed on
Why uOttawa Prof. Andre Vellino refused academic support to postdoc