Data spread or data variability of a distribution is the extent to which the scores vary around their central tendency. Data spread is a measure of how far the numbers in a data set are away from the mean or median. Common methods to investigate the variability in data sets are the range, the interquartile range, and the standard deviation. This post constitutes Lesson 4 of the Basic Statistics Mini-Course.
You may be also interested in Normal distribution or Gaussian distribution.
Key concepts covered in this post: range, interquartile range, box and whisker plots, mean deviation, standard deviation, measuring variability in grouped data, Chebyshev’s theorem.
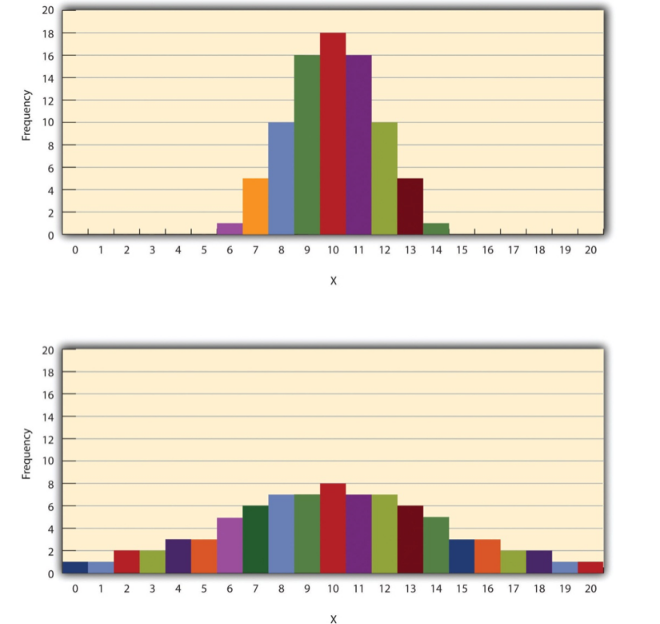
Consider the following two histograms (Price, Jhangiani, & I-Chant A., n. d.). They have the same mean, median, and mode (10) but differ in the amount spread: Low variability (top) and high variability (bottom). If the data are spread out widely, the measures of central tendency are less likely to accurately describe the population from which the sample was taken.
Range
The range is the difference between the highest and lowest values (scores) in a sample. We can investigate the spread of the central half of a distribution by dividing the sample into quartiles (fourths) while ignoring the quartiles at the ends. The interquartile range is the region covered by the two middle quartiles.
One way (convention) to determine the interquartile range is as follows:
The lower quartile QL: n + 1/4 th value (position), rounded up to the nearest integer to approximate QL.
The upper quartile QU: 3(n + 1/4) th value, rounded down to the nearest integer to approximate QU.
The upper quartile QU: 3(n + 1/4) th value, rounded down to the nearest integer to approximate QU.
Interquartile range
Example 1: Suppose the following data represent the monthly phone bills of a sample of 20 households (sorted out from lowest to highest). What is the interquartile range?
30, 35, 39, 45, 52, 52, 54, 55, 56, 57, 60, 63, 65, 71, 74, 78, 79, 86, 108, 120.
QL = 20 + 1/4 = 5.25th position. The 6th value is 52 (25% of the data lie below 52).
QU = 3(20 + 1) = 15.75th position. The 15the value is 74 (25% of the data lie above 74).
The interquartile range: 74 – 52 = 22.
The interquartile range is usually divided by 2 and called the semi-interquartile range (i.e., 11).
A statistician would say that the median of the phone bills is $58.50 and half the bills fall within $11.00 of this amount.
Box and whisker plots
An interquartile range can be illustrated with a box and whisker plot (box plot or boxplot). We can thus notice outliers. An outlier is a point which falls more than 1.5 times the interquartile range.
From the previous example, on a number line from 30 to 120: QL can be approximated by 52, and QU can be approximated by 74. Between them is the median (58.50).
The interquartile range is 22, so any value lying more than 1.5(22) or 33 from the ends of the box is an outlier. So this would include values less than 19 and greater than 107 (hence 120 is the only outlier in our data set example).
(Due to difficulties inserting some mathematical characters in WordPress, please finish reading this post in the embedded Google Doc below. You can jump to Mean deviation.)
Back to Basic Statistics Mini-Course
Back to DTI Courses
Related content
Bivariate statistics or two variable statistics
Data presentation in statistics
Normal approximation to the binomial distribution
Normal distribution or Gaussian distribution
Other content
1st Annual University of Ottawa Supervisor Bullying ESG Business Risk Assessment Briefing
Disgraced uOttawa President Jacques Frémont ignores bullying problem
How to end supervisor bullying at uOttawa
PhD in DTI uOttawa program review
Rocci Luppicini – Supervisor bullying at uOttawa case updates
The case for policy reform: Tyranny
The trouble with uOttawa Prof. A. Vellino
The ugly truth about uOttawa Prof. Liam Peyton
uOttawa engineering supervisor bullying scandal
uOttawa President Jacques Frémont ignores university bullying problem
uOttawa Prof. Liam Peyton denies academic support to postdoc
Updated uOttawa policies and regulations: A power grab
What you must know about uOttawa Prof. Rocci Luppicini
Why a PhD from uOttawa may not be worth the paper it’s printed on
Why uOttawa Prof. Andre Vellino refused academic support to postdoc