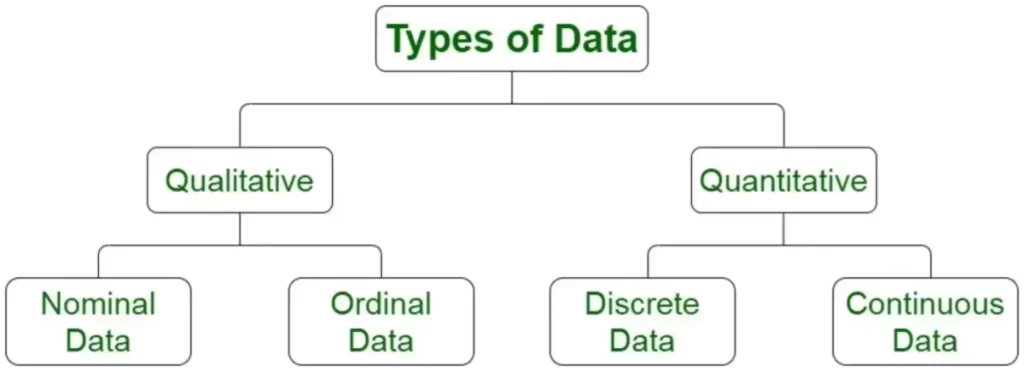
Data presentation in statistics
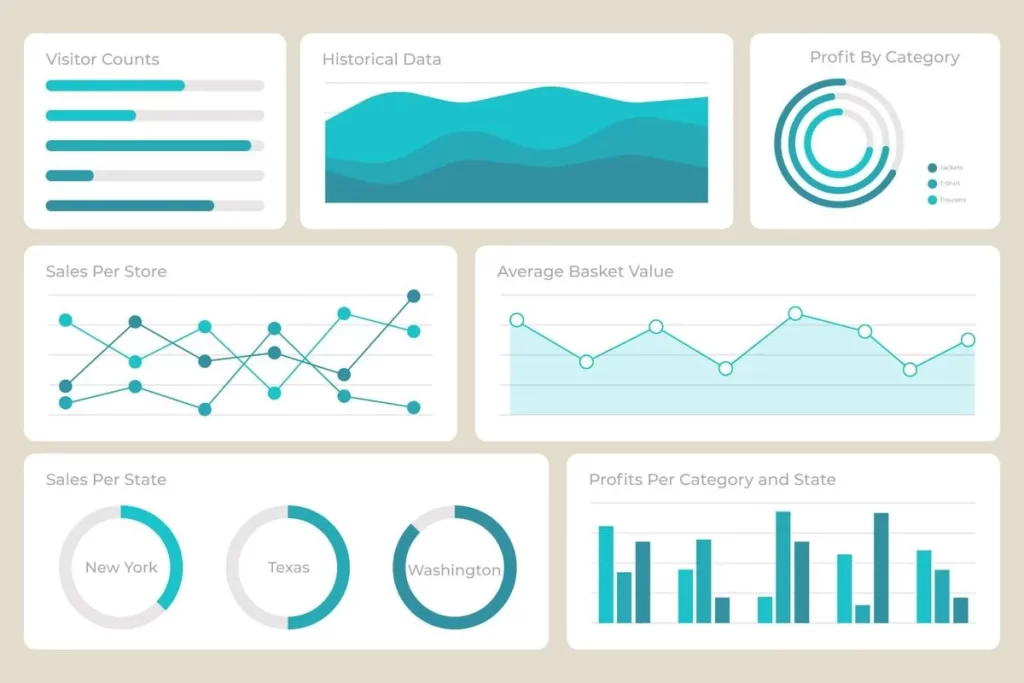
Data presentation in statistics is done using tables, charts, diagrams, or graphs and is part of the data analysis and reporting phase of the data analysis life cycle. Visual data presentation helps data analysists identify and understand relationships between and within data sets to inform science-based decision making. This post constitutes Lesson 2 of the Basic […]
Data presentation in statistics Read More »